What is the Box Cox Transformation?
A Box Cox Transformation is a simple calculation that may help your data set follow a normal distribution. Box Cox transformation was first developed by two British statisticians, namely George Box and Sir David Cox.
When the assumption of data normally distributed is violated, or the relationship between the dependent and independent variables in the case of a linear model is not linear, in such situations some transformation methods may help the data set follow a normal distribution. Box Cox is one such transformation method.
The basic assumption of Box-Cox is data must be positive (no negative values) and also data should be continuous.
What Does Box Cox have to do with Multiple Regression Analysis?
Box-Cox transformation is the basic tool in Multiple Regression Analysis. The assumption of any linear model is that relationship between the response variable Y, and the predictor variable X is linear; however, this is not true all the time, so when the relationship between the dependent variable and independent variable is not linear and still wish to fit a linear model to the data then consider a Box-Cox transformation method. This will transform the predictor variable or the response variable and then fit a linear model to the data to study the predictor variable’s effect on the transformed responses.
We assume that linear models have normally distributed error terms – a basic assumption. Significant violation of the assumption also leads to committing the type I or type II error.
In addition, the benefits of Box-Cox transformation include less skewness, maintaining the linear relationship between response variable Y and the predictor variable X’s, almost equal spread, etc.,
The Box Cox Equation
The original form of the Box Cox transformation is given by
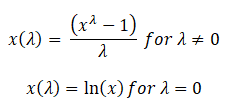
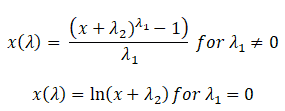
In a 1964 paper, Box-Cox proposed an extended form of the two-parameter Box-Cox transformation
When would you use this transformation during the DMAIC process?
Process capability studies are performed during the Measure phase of DMAIC. The first step for process capability studies is to check whether the data follows normal distribution or not (it is more important for parametric tests like ANOVA etc.).
The Box-Cox method helps to address non-normally distributed data by transforming it to normalize the data. However, there is no guarantee that data follows normality because it does not really check for normality.
The Box-Cox method checks whether the standard deviation is the smallest or not. Hence it is always advisable to check the transformed data for normality using a probability plot or Q-Q(Quantile-Quantile) plot.
How to use Box Cox to calculate Process capability for non-normal data
There may be no advantage in calculating the process capability for non-normal raw data, in other words, it may give inaccurate results. Data should be transformed to normalize before calculating the process capability. While there are various data transformation methods exist like log transformation, power transformation, Exponential, Reciprocal, etc.,
In order to use the right transformation method, some data analysis may be required. One of the foremost power transformation methods is the Box-Cox method.
The formula is yI = yLambda
Where Lambda power must be determined to transform the data, the usual assumption of parameter Lambda values varies between -5 and 5. The likelihood of transformed data is maximum, and data are normally distributed when the standard deviation value is small.
Most Common Box-Cox Transformations
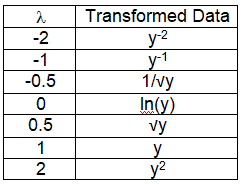
Example: if the Lambda is 2 then yLambda = y2
An Example of a Box Cox Transformation by Hand
Box Cox transformations in practice are typically done by leveraging software that can try many different variations of Box Cox transforms very quickly.
Doing it by hand in practice is time-consuming and error-prone. Imagine trying varying types of lambda by hand until you run them all or run out of patience!
“But what about on a Six Sigma exam?” I can hear you say. “I won’t have MiniTab or R Studio available! What will I do?”
Not to worry.
In my experience, the questions on the exam are rather simple. You’re usually just having to do or understand the following:
- Sometimes your data doesn’t appear to be normal, but if you transform it, you can achieve normality–which then opens up a bunch of other properties and tools for you (or at least easier tools;’)).
- While Box-Cox is complex, questions on Six Sigma exams are usually very simple. Just substitute variables into the following equation:
- X(transform) = X ^ Lambda
Example: if the Lambda is 2 then yI = y2
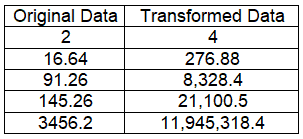
You must replace your original data with the “new equation” using a lambda of 2.
As the example chart here shows, all you’d have to do is just square the original value.
“Old measure” 2 now becomes “New measure” 4 because we are simply substituting into X(transform) = X ^ Lambda for the following: X(2) = 2 ^ 2.
An Example of a Box-Cox Transformation Using Minitab
An Example of a Box-Cox Transformation Using Minitab
Box Cox Transformation in Minitab tool, Excel Analysis tool pack, or any other statistical software tools. These tools automatically calculate an appropriate power transformation
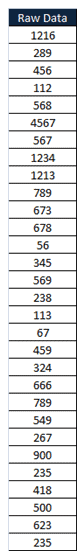
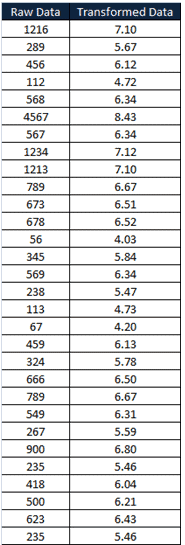
Example: Raw data
Step 1: Perform the normality test to see whether the data follows normal distribution or not
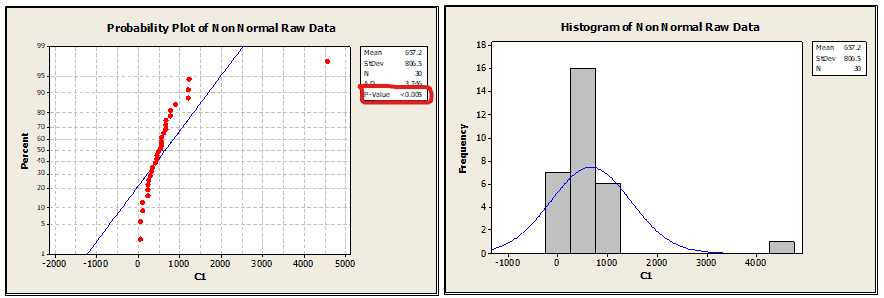
From the above graph, the P value is less than 0.005; hence the data does not follow a normal distribution, and the histogram clearly shows data skewed on one side.
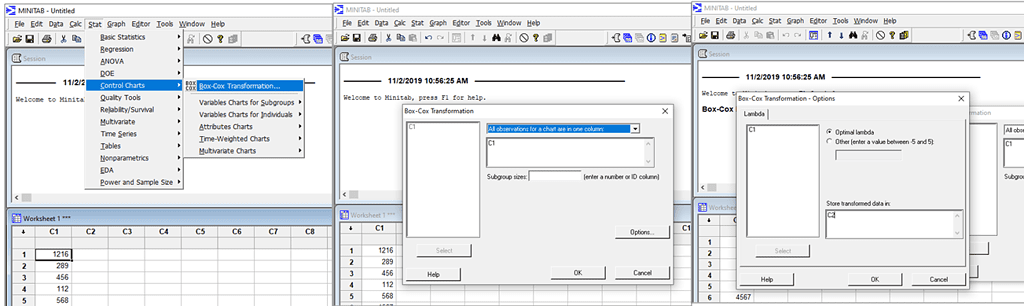
Step 2: Transform the data using Box-Cox Transformation
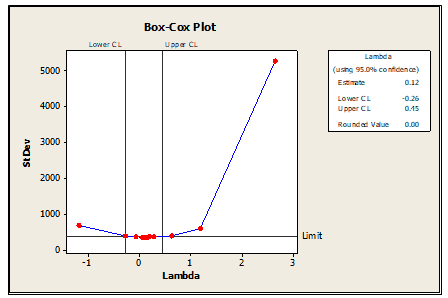
Transformed data
Step 3: Again test the normality
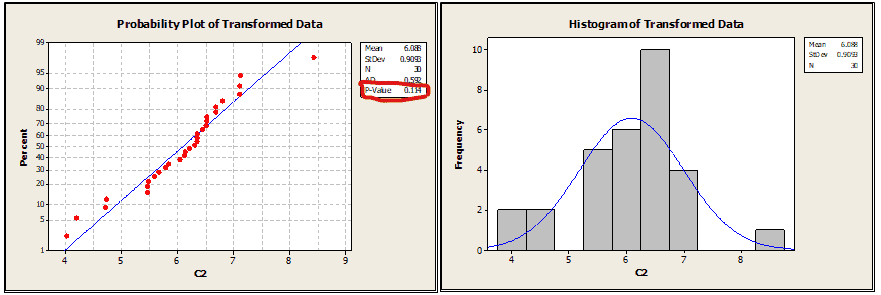
From the above graph, the p-value is greater than 0.05; hence it is clear that the data follows a normal distribution, and from the histogram also, we can see the data is uniformly distributed.
What Do You Need to Know for Your Six Sigma Exam?
Green Belt
The IASSC Six Sigma Green Belt BOK requires as part of the Improve Phase.
Black Belt
The IASSC Six Sigma Black Belt BOK requires as part of the Improve Phase.
The ASQ Six Sigma Black Belt BOK requires the following:
Process capability for non-normal data
Identify non-normal data and determine when it is appropriate to use Box-Cox or other transformation techniques. (Apply)
Helpful Videos
This first video has poor audio but gives a good overview.
This second video shows a great practical example of leveraging R studio. You’re unlikely to have to go into this level of detail on an exam. I include it because it’s a great example with very helpful plots of data that help you visualize what a transformation can do to help you progress through your data analysis and come to viable conclusions.
Comments (14)
I think this page might be incomplete? Also the link isn’t connecting. Thanks Ted!
You’re correct, Larry. I have it scheduled for later 4th Quarter.
I’ll see what I can do to advance the timeline.
Dear Ted,
Can you share the process of how the value of lambda is derived?
How do we decide for the below that Lambda is 2 or any other value?
Example: if the Lambda is 2 then yI = y2
Thanks
Anshika
Hi Anshika,
Good question. The greek character Lambda didn’t come out well in the example so I’ve changed it above.
It now reads if Lambda is 2, then Y^Lambda = Y^2.
Think of it this way. The most important thing to remember is that the heart of the Box Cox transformation is an exponent, lambda (λ).
Lambda can vary from -5 to 5.
What you’re trying to do is to transform your existing function into something that looks and acts like a more ‘normal’ distribution.
In practice you would try all kinds of values for lambda to see what works best. Obviously automated tools help.
The best version of lambda would be the one that results in transforming your data into the best approximation of a normal distribution curve.
Does that help?
Hello Ted,
Do you have any bibliographic support that I can use to explain a maximum variance of Lambda from -5 and 5 in my work. I have performed box-cox transformations and I have seen that for larger lambdas (like 9)an approximation to normality cant be properly performed.
Thanks
André
I don’t have a reference at hand.
Here are 2 places you might examine (1 the linked article, 2 the article they mention by Draper and Cox):
Are there any limitations to the usage of Box-Cox Transformation? In simple terms, does it hold valid for every scenario/analysis or are there any exceptions to the usage?
What happen to x and y plot when we tansfrom it?
Nural,
You generally use a transform for a specific purpose, usually to make dealing with the data / function easier. The effects of the transform are dependent on what you transform into what.
One of the most popular transforms is towards a ‘normal’ distribution. In that case, what would you imagine an X Y plot would look like?
Hi Nurul syafika,
The effect of the Box-Cox transformation on an x and y plot depends on the specific characteristics of the data and the chosen lambda value. Like
1. No Transformation: If the data already meet the assumptions of normality and homoscedasticity (equal variances), applying the Box-Cox transformation may not have a significant impact on the x and y plot.
2. Positive Skewness: If the data exhibit positive skewness (right-tail heavy), applying a Box-Cox transformation with a lambda less than 1 can help reduce the skewness.
3. Negative Skewness: If the data exhibit negative skewness (left-tail heavy), applying a Box-Cox transformation with a lambda greater than 1 can help reduce the skewness.
4. Heteroscedasticity: If the data exhibit heteroscedasticity (unequal variances), applying a Box-Cox transformation can help stabilize the variances.
Thanks
The book Statistics for Experimenters (Box, Hunter and Hunter, 1979?) details how to linearly regress replicate log standard deviation on log mean in order to deduce the lambda parameter.
Thank you for adding that, Larry! Hope you’re doing well!
what is the actual lambda value of boxcox transformation? Like lambda = 0 is for log transformation and lambda = 0.5 is for square root transformation then what is the lambda value of boxcox tranformation?
The lambda power must be determined to transform the data, the usual assumption of parameter Lambda values varies between -5 and 5. The likelihood of transformed data is maximum, and data are normally distributed when the standard deviation value is small.