Canonical Correlation Analysis identifies and measures the correlation between two sets of variables. It’s a similar technique to PCA/Factor analysis. In particular, canonical correlation analysis seeks the best sets of linear combinations with independent variables related to dependent variables. Hotelling first developed the Canonical Correlation method in the year 1935, but it was not widely used until computers with statistical software arrived on the scene 50 years later.
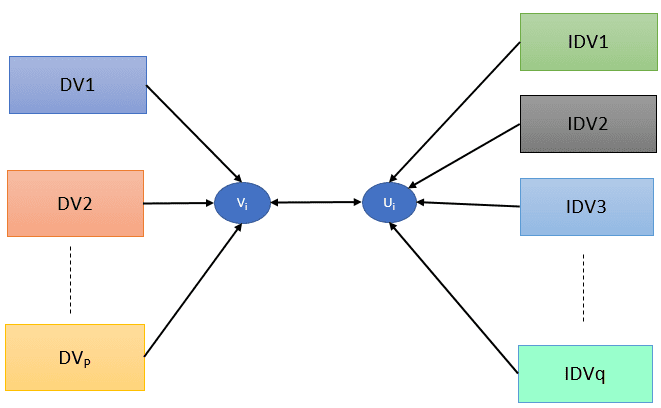
Canonical Correlation requires each set of variables to be reduced to a single variable and then finding their variables. Moreover, The two variables are found by taking linear combinations of the variables in each set under certain pre-fixed conditions. The output variables obtained from the linear combination are called canonical variables, so the correlation between them is called Canonical Correlation.
Why Canonical Correlation
Canonical Correlation is a technique that seeks to identify and quantify the relationship between two sets of variables. Furthermore, it is a popular statistical technique and is widely used in many areas of social science, psychological research, and marketing analytics. Unlike a regression analysis, researchers can monitor the relationship between many dependent and independent variables.
Assumptions
Most of the multivariate technique assumptions apply to Canonical Correlation.
- Assumes the linear relationship between the dependent and independent variables
- Independent variables should not be highly correlated
- Uniform variability
- Additionally, multivariate normality is necessary to perform a statistical test.
Difference between Multiple Correlation and Canonical Correlation
Generally, we study the relationship between one dependent and independent variable in a simple correlation. Similarly, we study the relationship between one dependent variable and multiple independent variables in Multiple Correlations. In other words, it investigates the relationship between a variable Y and a set of variables (X1, X2,…Xn). Whereas in Canonical Correlation, we study the relationship between two sets of variables. It is similar to multiple regression; however, we have more than one dependent variable.
Formula and Nomenclature
Let X and Y be the dimensional random vectors, p, and q, and assume that p≤q
Let µX and µY be the mean of Y and X, and let ΣX and ΣY be the covariance matrix of X and Y
U = aTY and V= bTY be linear combinations of Y and X, respectively
So,
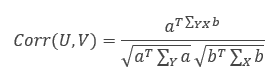
- Var(U) = aT ΣYa
- Var(V) = bT ΣXb
- Cov(U,V) = aT ΣYXb
Therefore, the correlation between U and V
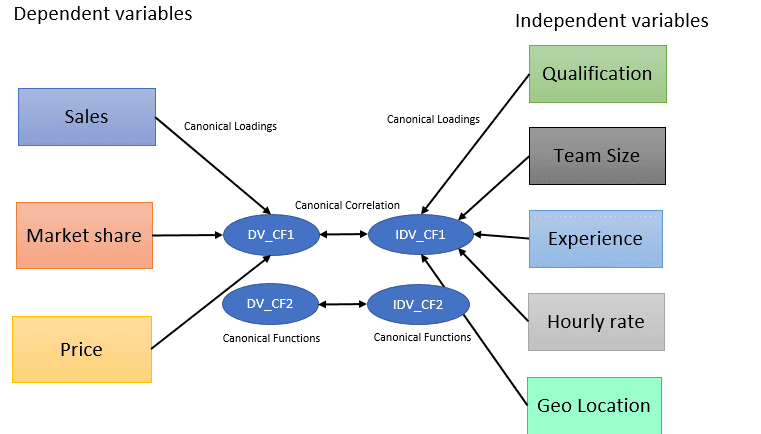
- Canonical Function: Analogues to components in a principal component analysis
- Canonical Correlation: Correlation between two canonical function
- Structure coefficient / Canonical loadings: Correlation between a variable and its canonical functions
- Eigenvalue value: It represents the percent of the variance in one variable accounted for by another variable. Think of it like the canonical correlation’s version of R2.
The canonical correlation coefficient is similar to the Pearson correlation coefficient–usually, it should be more than 0.30. The squared value represents less than 10% in overlapping variance between pairs of canonical variates.
It is difficult to perform the canonical correlation manually; different software packages like SPSS, R, Matlab, and Python will help to compute the analysis.
Also, see Multivariate Analysis
Helpful Links
- https://en.wikipedia.org/wiki/Canonical_correlation
- https://stats.idre.ucla.edu/r/dae/canonical-correlation-analysis/
- https://online.stat.psu.edu/stat505/book/export/html/682
Helpful Videos
ASQ Six Sigma Green Belt Correlation Analysis Questions:
Question: A correlation analysis provides a numeric value for which of the following types of relationships between two variables?
A) Random
B) Linear
C) Curvilinear
D) Causation
Answer:
B: Linear. This is a definition of correlation analysis. You could easily rule out random, though – there is no relationship between random events. It would also be helpful to see the articles on correlation coefficient and regression analysis to see this in action.