The Control phase is the fifth and last phase of a DMAIC process. The main activity in the Control phase is to control the improved process. In other words, the control phase ensures the new process is implemented and doesn’t revert to old ways.
The focus of the control phase is to implement whatever changes we have decided on in the improve phase of DMAIC for the new process. We’ve positioned the new process for success that was well implemented and maintained. In addition, we successfully transitioned all responsibilities to the new owner.
At the end of the Control phase process, owners are responsible for enforcing the new process.
Six Sigma Phases
Six Sigma is a systematic problem-solving approach centered around defect elimination and variation reduction leading to process improvement.
One of the principal tools in Six Sigma is the use of the DMAIC methodology. (Also see DMAIC Overview). Particularly, DMAIC is a logical framework that helps you think through and plan improvements to a process to achieve a Six Sigma level of excellence.
There are five phases that are used in the DMAIC method.
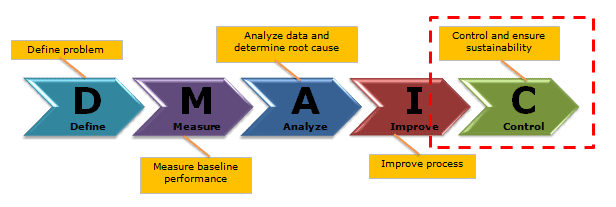
The main objective of the Control phase is to measure the new process characteristics and validate the improvement. Then implement a control plan and response plan to ensure the new process is strictly implemented. Institutionalize the improvements by developing procedures/work instructions and transitioning the improved process to the operations team.
Control Phase of DMAIC Goals
- Develop Control Plan
- Validate the solution
- Statistical process control
- Implementation plan
- Cost-benefit analysis
- Formal project closure
- Celebrate success and recognize the team
Control Phase of DMAIC Overview
The Control phase is approximately a 2 to 3 weeks process.
The activities in the Control phase are to create and update standard works or work instructions. Quantify the dollar savings and get the financial controller’s concurrence. Create and implement a process monitoring mechanism using control charts. Then prepare a control plan and reaction to remain an effective mechanism to monitor and control the process.
Finally, gain the management’s approval, update lessons learned, formally close the project, and hand over the process to the process owner. Multiple tools and concepts are available in the Control phase of six sigma.
Statistical Process Control
Statistical Process Control (SPC) is a statistical method to measure, monitor, and control a process. In other words, SPC is a quality control method that employs statistical methods to measure, monitor, and control a process.
Rational Subgrouping
Rational subgrouping is the process of organizing the data into groups that were produced basically under the same conditions. It helps in the estimation process of short-term variations. Thus, Rational subgrouping is the basis for operating control charts in a successful manner. These variations later help us predict the long-term variations and their control limits, depending on the type of causes for the variation (special or common).
Control Chart
A control chart is one of the primary techniques of statistical process control (SPC). The control chart is a graphical display of quality characteristics that have been measured or computed from a sample versus the sample number or time.
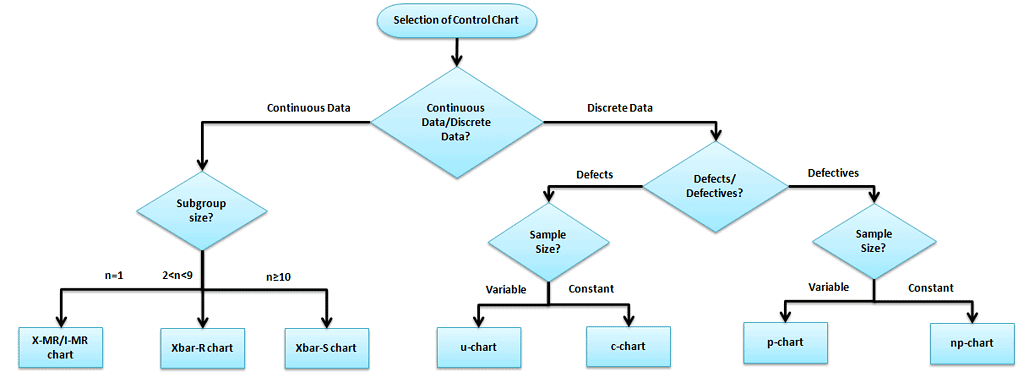
Variable (Continuous) Control Charts
Measure the output on a continuous scale. It is possible to measure the quality characteristics of a product.
- X bar – R Charts (when data is readily available) X bar R chart is used to monitor the process performance of continuous data and the data to be collected in subgroups at a set time period.
- Run Charts (limited single-point data) A run chart displays observed data as they evolve over time. Just a basic graph that displays data values in a time order.
- X – MR Charts (I – MR, individual moving range) An Individual moving range (I-MR ) chart is used when continuous data is not collected in subgroups.
- X bar – S Charts (when sigma is readily available) X Bar S charts are used when the subgroups have large sample sizes, and the S chart provides a better understanding of the spread of subgroup data than range.
- EWMA Chart: The EWMA – The purpose of the Exponentially Weighted Moving Average chart is to monitor variables (or attributes that act like variables) that use the entire history of a given output.
Attribute(Discrete) Control Charts:
The output is a decision or counting. It is not possible to measure the quality characteristics of a product. In other words, it is based on the visual inspection like good or bad, fail or pass, accept or reject.
- p Charts: (for defectives – sample size varies) – Use P chart when the data are the fraction defective of some set of the process output.
- np Charts (for defectives – sample size fixed) – Use an np-chart when the data is collected in subgroups that are the same size.
- c Charts (for defects – sample size fixed) – Use c charts when the data are concerned with the number of defects in a product. The number of defects collected for the area of opportunity in each subgroup.
- u Charts (for defects – sample size varies) – A u chart is an attribute control chart that displays how the frequency of defects, or nonconformities, is changing over time for a process or system.
Maintain Controls
Comparisons: Before & After
Compare the baseline sigma and new sigma. This is especially needed when there is a shift (8 data points above/below the historical mean). Otherwise, when a new process replaces the old one permanently, but wait to do so until you have 24 data points.
Maintaining Solutions
Standardization / Throughput matrix
- Understand the throughput standardization matrix to determine your method of process control.
- When maintaining solutions, the type of control you should use is primarily determined by where your process is located on the standardization/throughput matrix.
- Understand the basic method of interpreting and responding to statistical control charts.
Control Plan
A control plan is an example of a quality control (QC) strategy. Put one in place after you create a new process or change an existing one. It helps you to ensure that staff monitors new and modified processes correctly.
A plan for a product – or service – typically contains:
- The name of the item.
- Its important characteristics. For example, length, width, color, and strength.
- How to measure those characteristics. For example, the tool you need to use.
- The acceptable range for each characteristic. Commonly called the tolerance range.
- Testing frequency. This might be a time period (once an hour) or amount (1 per 1000).
- How to plot measurements. This will usually be a type of chart.
- Who is responsible for quality control on the item?
It might also include:
- Contingency measures to take for certain scenarios.
- When and how to review the plan.
Sustain Improvements
Documentation
Examine the importance of documentation. Remember, variation is still the enemy! We want to ensure that any new process documentation is clear, easy to follow, and written in the language of the people adopting it, so no new variations creep in.
Analyze how it supports sustaining the gains of a Lean Six Sigma project. Conduct training on a new process for all the employees and communicate the results. In addition, a new process must be easily repeatable & reproducible. Write it with a new user in mind. Explain the benefits of using the new process. Furthermore, focus on any causal factors that might disrupt the new process. Make sure to keep the new process in control. Ex. Measuring plan, Control chart.
Document lessons learned
Documenting the lessons learned is one of the last steps in the project closure. This review is often formal, and documentation is conducted by SMEs and process-knowledge individuals.
- Good questions to ask:
- How effective was the data used?
- The confidence that the process we used to come up with the solutions is repeatable?
- How confident are we that the new process will have lasting success?
Summarize future plans
- Plan the future data collection.
- How did actual implementation data compare to what was forecast? Did we get the improvements we were after?
- Get the project savings ($ value) concurrence from the financial controller.
- Update the status to top management.
- Communicate to everyone involved in the project–it’s time to celebrate!
- Recognize the team.
Control Phase of DMAIC Deliverables
- Process monitoring (control charts)
- Control plan
- Work Instructions/SOPs
- Training Plan
- Financial savings
- Update the Lessons Learnt database
- Project closure
- Celebrate the success and recognize the team
Comments (1)
Wonderful video resources! Ted completed a comprehensive summary of the last phase of the DMAIC process: Control.