
Critical Path Method (CPM) is one of my favorite visual project management tools. CPM calculates a project’s duration from start to finish and identifies the critical path of that project. The critical path is the set of activities that cannot be delayed; otherwise, the entire project is at risk of completing late.
To better understand the purpose of CPM, let’s begin with a scenario.
Jim has the same routine he does every day to get ready for work. He wakes up, showers, gets dressed, eats breakfast, wakes up his kids and gets them dressed for school, shaves, and brushes his teeth. All in all, it takes Jim roughly an hour to complete these tasks before he can drive to work.
Well, what happens when Jim’s alarm doesn’t go off and he wakes up 20 minutes late? Being the good employee Jim is, he will do everything he can to come to work on time. What changes does Jim need to make to his morning routine to be at work on time?
This scenario is a good base for understanding the uses of the Critical Path Method. CPM is a technique for planning and controlling the activities of a project. Though it is very similar to PERT, CPM focuses on costs and zeroes in on the critical path of a project.
What is the Critical Path?
With any given project, the activities involved follow a sequence. In other words, some steps in a project must proceed after the other steps finish.
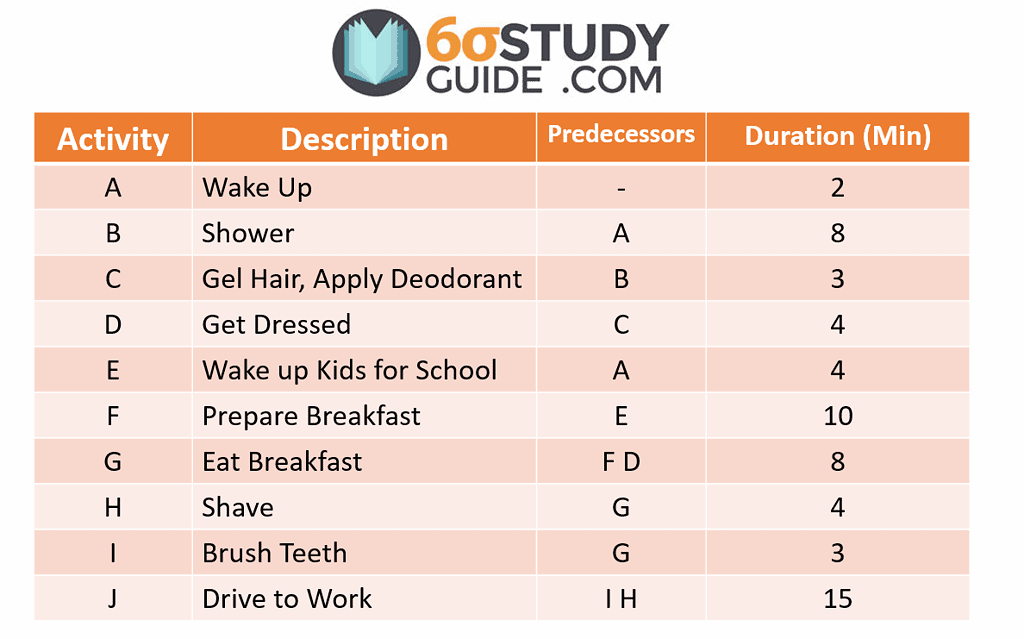
In our story with Jim, he knows everything he must do in order to feel ready for the day. He lists them in a chart like this:

However, following the correct order is the priority. For example, Jim cannot dress in clothes before taking a shower. Doing so would cost him more time than he had available. So he added an additional column labeled predecessors to show the order of activities. This chart is called the Work Breakdown Structure.

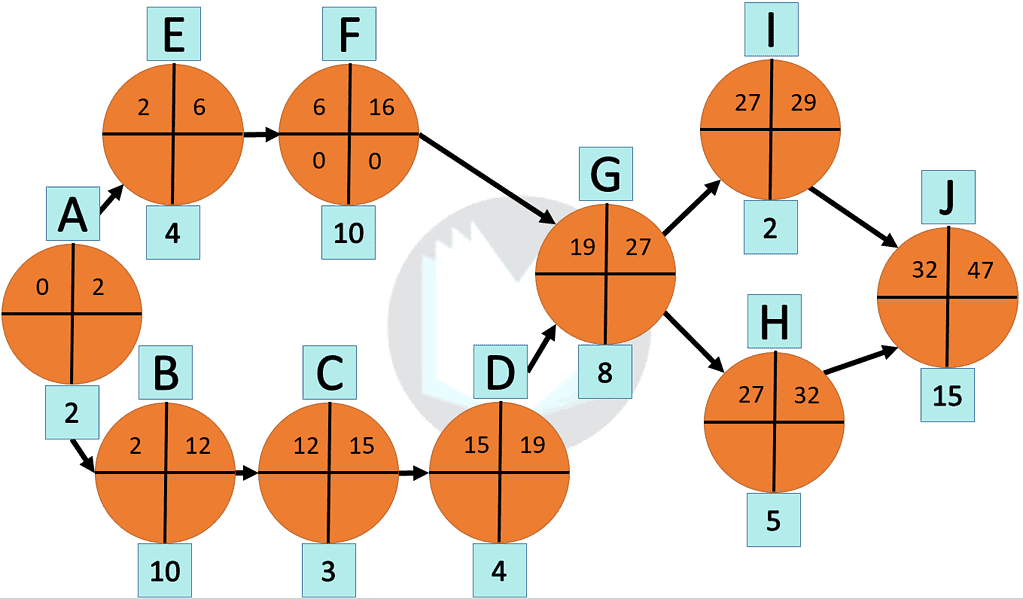
A visual representation of this chart would look something like this:

This visual, also known as a Network Diagram, uses small circles to represent project activities. The lines show precedent relationships among each activity. With the diagram complete, we begin to see bottlenecks in the process. Bottlenecks are constraints in a process. In other words, any delay to an activity will result in an overall delay in the process.
In order to define where the bottlenecks are in Jim’s daily routine, we need to know how long each activity takes. The duration of each activity is added to our Work Breakdown Structure below.
How to Determine the Project’s Duration?
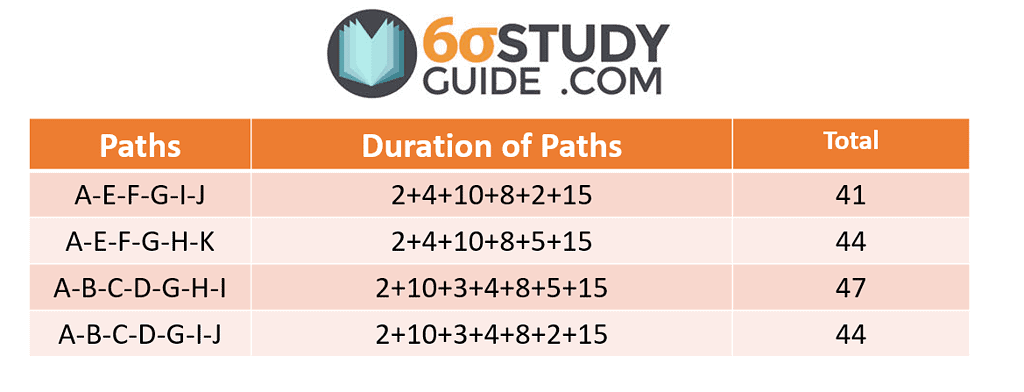
The project duration is calculated by first determining how many paths there are from start to finish. Based on our example, Jim has a total of four paths. Next, add the duration of each path to calculate the total time required to complete the course. Lastly, determine which path takes the most time. In our example, Jim’s longest path is A-B-C-D-G-I-J, a total time of 47 minutes.
Calculating Slack Time in Critical Path Method
Simply put, slack time is the amount of time an activity may delay without extending the entire duration of the project. To calculate slack time, we need to add a few more terms to our vocabulary:
ES (Earliest Start) Moving from start to finish in the project, the earliest start is the time taken up to the current activity in the process.
EF (Earliest Finish) Earliest Finish takes the time calculated in ES and adds the current activity’s time to the total duration.
LS (Latest Start) Moving backward from finish to start, the Latest start calculates the time taken up to the current activity in the process. Opposite of ES
LF (Latest Finish) Earliest Finish takes the time calculated in LS and adds the current activity’s time to the total duration. Opposite of EF
Slack Time = LS – ES or LF – EF
To easily organize these values, use the following figure for your network diagram.


Calculating Earliest Start & Earliest Finish
First and foremost, input the duration time of each activity. Next, starting from activity A, calculate the Earliest Start. The Earliest Start is easy because it is always zero for the first activity. Then, calculate the Earliest Finish by adding the Earliest Start and the activity duration.
For example, Activity A’s Earliest start is equal to zero because it is the very first activity. The Earliest Finish for activity A is (0 + 2) to equal 2. The next activity’s ES is the Earliest Finish value from its previous activity. But notice what is the Earliest Start when an activity has two predecessors, as seen in activity G? Activity G’s Earliest Start value is the greater of its predecessors. In this case, Activity D has a longer Earliest Finish than Activity F, so Activity G’s Earliest Start equals 19.
Lastly, follow this pattern of calculating ES and EF from activity to activity until you reach the end of the process.
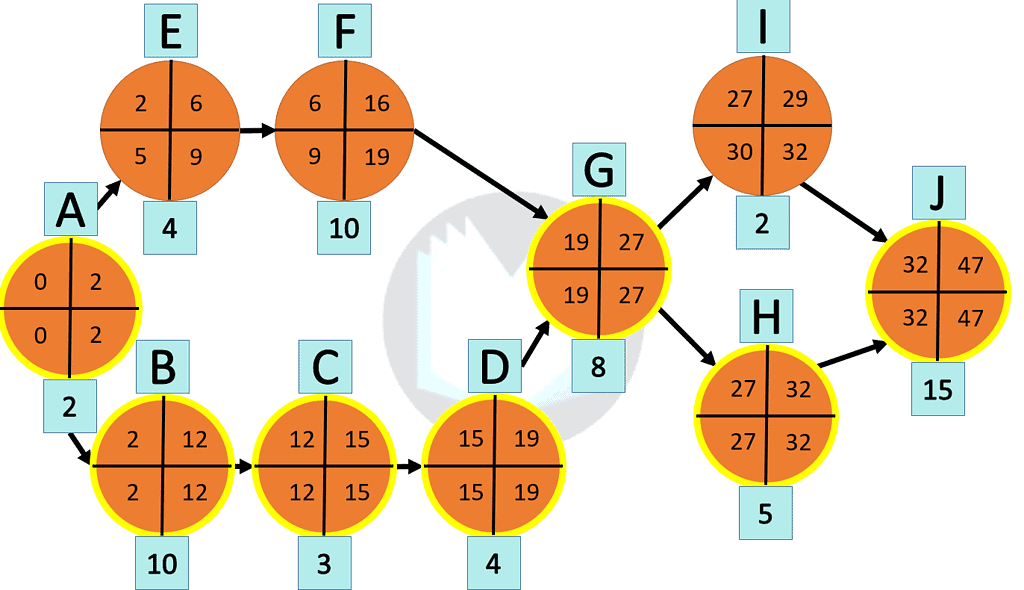
Calculating the Latest Start & Latest Finish for the Critical Path Method
Determining LS and LF follows a similar pattern as ES and EF, except you’ll now work from the last activity in the process to the first.
Start by taking the duration of the project and mark it as the Latest Finish for the last activity in your process. In our example, the duration of the project is 47 minutes, so activity J’s LF equals 47 minutes. Note: The Earliest Finish and Latest Finish of the last activity in the process are always the same numbers.
Next, Subtract the activity’s duration from its Latest Finish to calculate its Latest Start. When an activity proceeds two or more activities like activity G and H&I, the Latest Finish for the next activity equals the smallest of either’s Latest Start.
Lastly, follow this pattern of calculating LF and LS from activity to activity until you’ve reached the start of the process.
Calculating Slack Time:
Slack Time is the easiest thing to calculate now that we have defined the ES, EF, LS, and LF in the process. Slack Time is simply the Latest Start – Earliest Finish or Latest Finish – Earliest Finish. When calculating Slack Time, we are looking for activities that equal zero. A Slack Time of zero means any additional time added to that activity will increase the entire duration of the project. Ultimately, activities with a zero slack time are the project’s critical path.
Consider compiling the data into a chart like this:
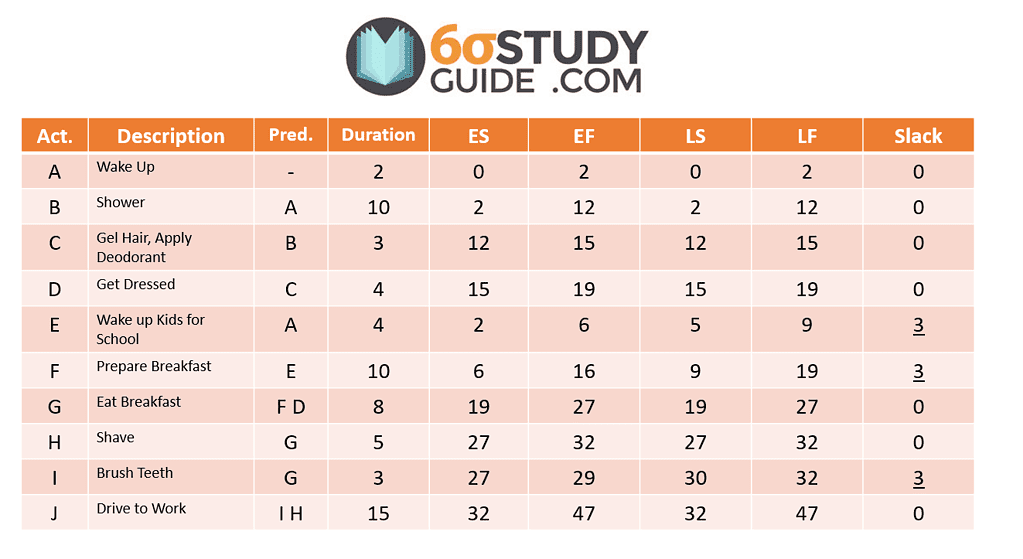
What do you do with the Critical Path?
Based on the above chart, we confirmed that A-B-C-D-G-H-J is the critical path. Now we can “crash” or expedite the pieces along the critical path for Jim to show up to work on time. But with anything that is expedited, there is a cost incurred. Even though we are discussing Jim’s daily routine for work, we will tack on “fees” Jim must pay to get to work on time. The fees are listed below:
A new meaning to it pays to sleep in, right?
How to Crash a Project
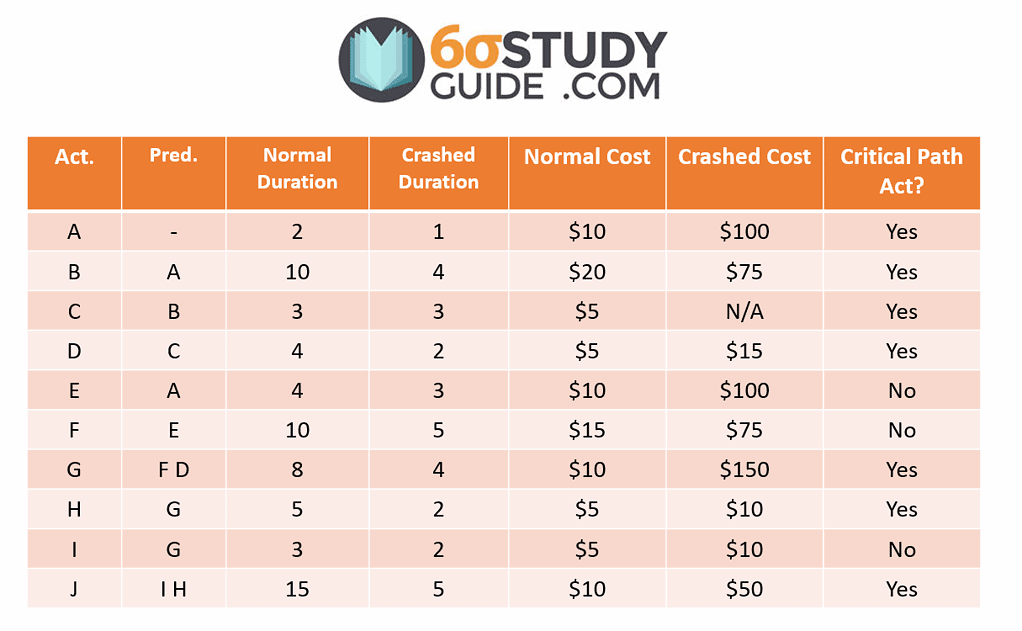
In order to crash a project, we must first determine which of these project expedites is worth the cost. To determine which activity to crash, we must answer yes to each of the following:
- Is the activity on the Critical Path?
- Is crashing the activity cost-effective?
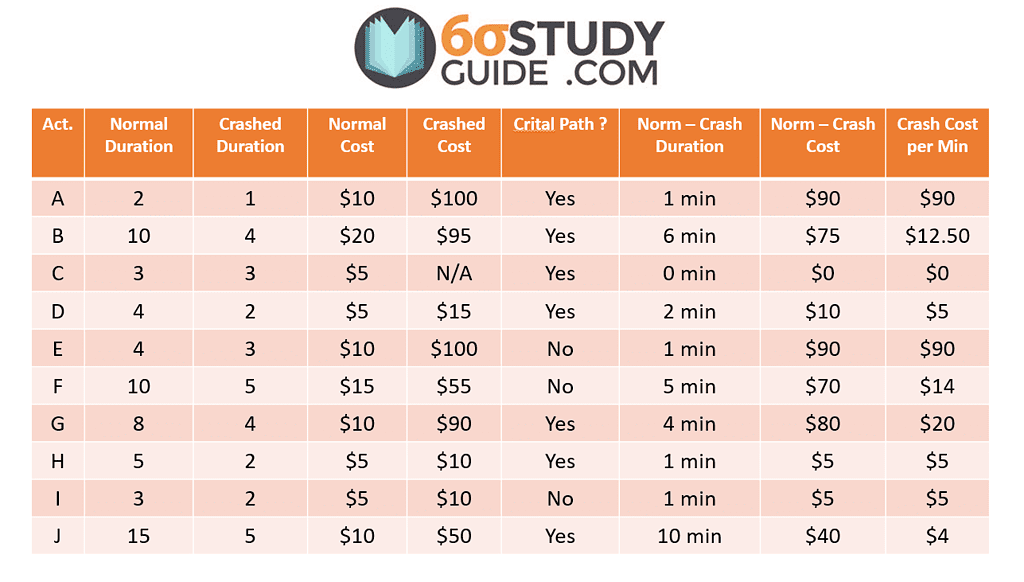
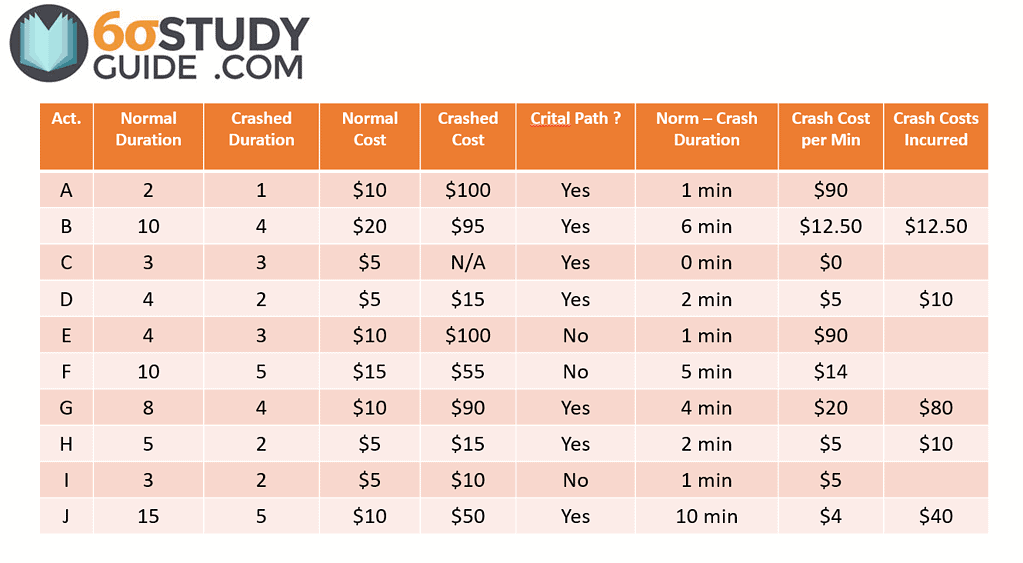
To understand if crashing an activity is cost-effective, we calculate the extra cost incurred per minute saved. In other words, we divide the Crashed Cost (-) Normal Cost from the Normal Duration (-) Crashed Duration. This gives us the crashed cost per minute for the activity. The most cost-effective crash is the lowest cost per minute of the listed activities.
IMPORTANT NOTE: You’ll notice how crashing an activity will change the project’s critical path. After each crash, confirm which activities remain on the critical path before further crashing the project.
After the first activity is crashed, repeat until you achieve the desired duration.
Crashing Jim’s Delay Routine Through the Critical Path Method
Remember, Jim woke up 20 minutes late, so the goal is to crash the project in order to recover the 20 minutes lost.
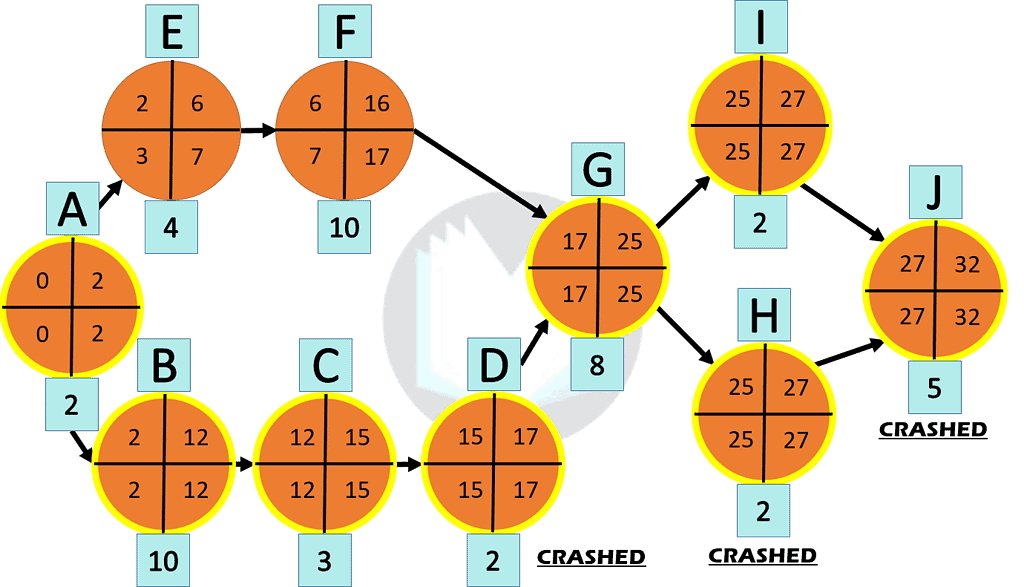
Based on the above chart, Driving to work (Activity J) is the first activity to crash because it is on the critical path and the cheapest. So Jim decides he needs to take toll roads to work in order to shave off 10 minutes.
Because activity J is the last activity in the project, crashing J does not change the project’s critical path.
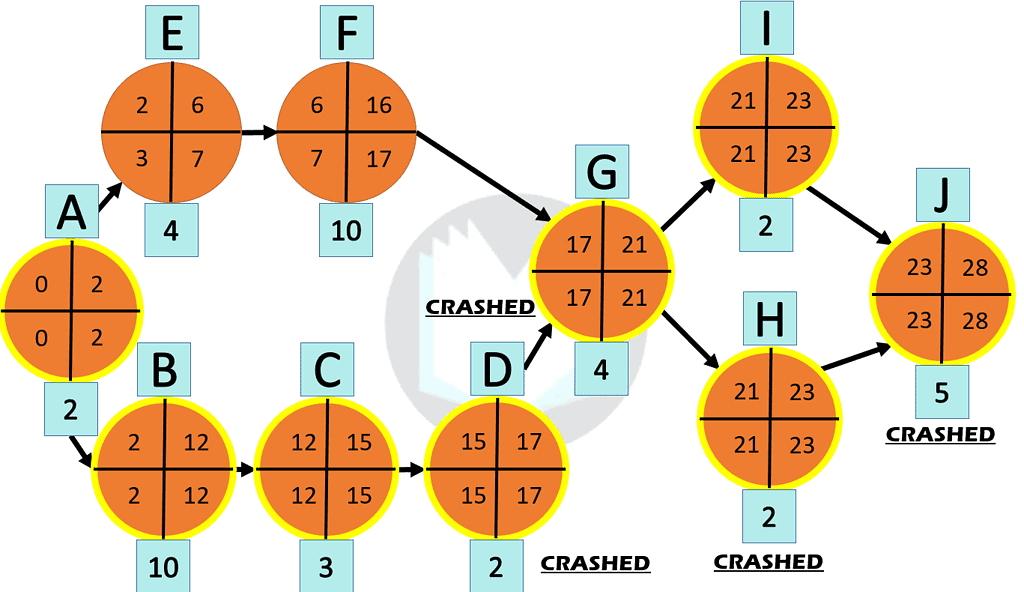
Second, Jim chooses to shave faster than usual to SHAVE off 3 minutes to his daily routine. Doing so now puts both Activities H & I on the critical path.
Question: Should Jim crash Activity I now that it is on the critical path?
Answer: No. Even though it is on the critical path, Activity J proceeds both H & I. Therefore, crashing Activity I to finish quicker than Activity H does not decrease the project’s duration.
Third, Jim expedites how quickly he can dress (Activity D) from 4 minutes to 2 minutes since it is on the critical path and is the next cheapest option at 5 dollars per minute.
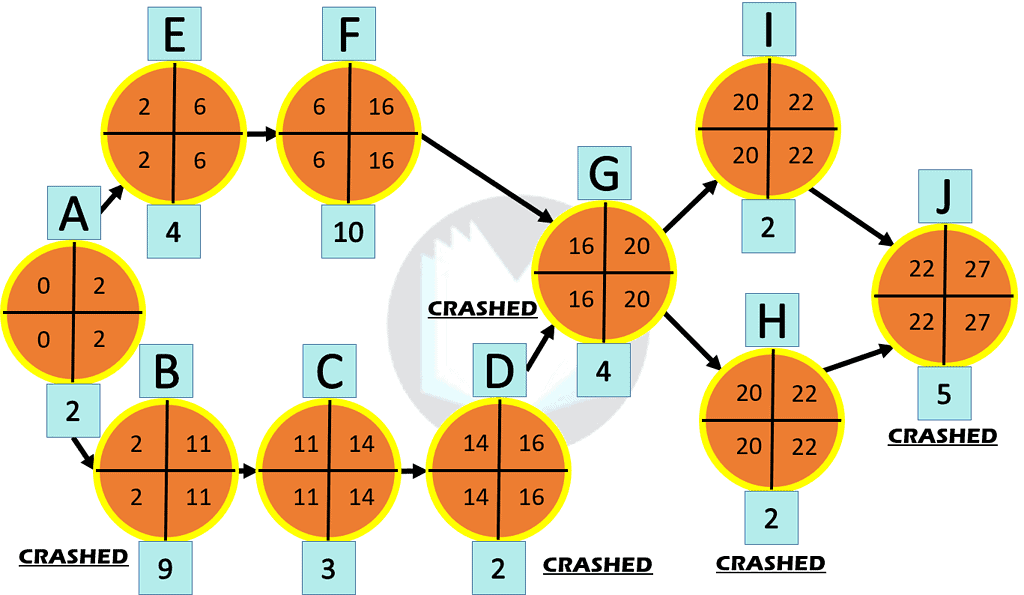
Question: Should Jim expedite Activity B?
Answer: No.
Now many of you may think that expediting Activity B is the next obvious choice because it is the next cheapest option on the critical path, but doing so is a critical error. Notice how the Earliest Finish time for Activity F is 16 minutes, whereas the EF for Activity D is 17. That means as soon as Activity D drops below 16 EF, the critical path shifts to A-E-F-G-(I/H)-J. To avoid unnecessary costs, crash the cheapest activity that both paths have in common. In this case, Activity G is the best activity to crash.
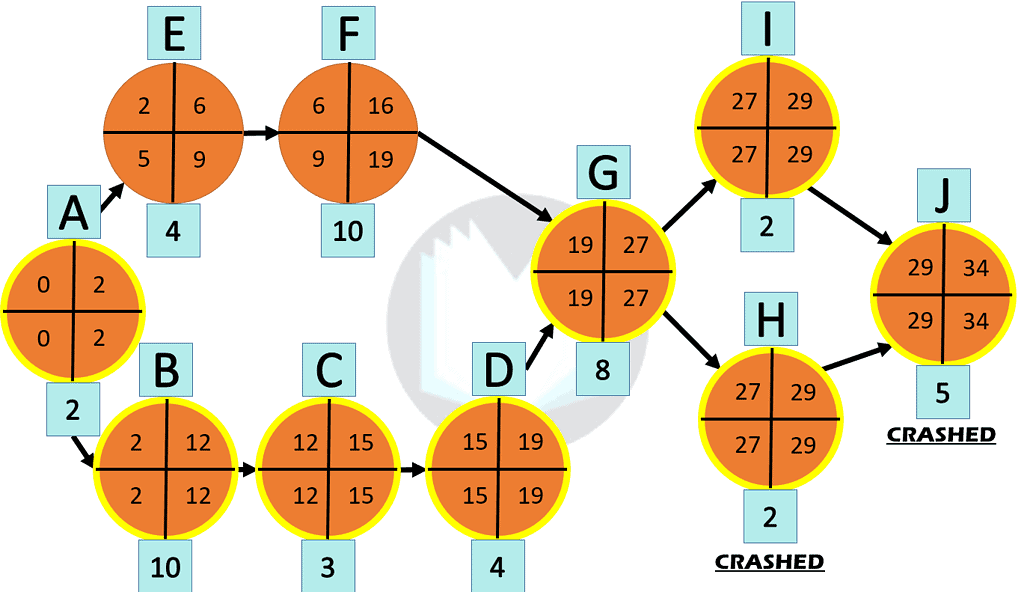
Jim crashes all 4 minutes of eating his breakfast, likely because he chowed it down as if in a food competition. This leaves Jim with 1 more minute to expedite so that he can be at work on time.
Lastly, Activity B (showering) is the next cheapest activity along the critical path. By crashing Activity B, Jim COULD recover an additional 6 minutes; however, Jim only needs to save 1 minute to get to work on time. In most real-life scenarios, expediting activities are usually all-or-nothing. In other words, you can save the specified time or see no improvement; there is no middle ground! But in the case of Jim, he can get away with taking a 9-minute shower, saving $62.50 in expedited costs.
The Results
And with that, Jim has proven successful in getting to work on time. His boss recognizes his efforts and gives him a raise. The dream, right?
The chart below shows the activities Jim crashed and the costs of crashing those activities. In total, it cost Jim $152.50 to save 20 minutes. Good thing Jim got a raise to cover those costs.
ASQ Six Sigma Green Belt Critical Path Questions
Question: The critical path for a project is best described as the:
(A) Sequence of steps with the highest costs
(B) Tasks in the project that have the highest risk of failure
(C) Sum of the tasks with the shortest time requirements
(D) Longest path from the start to the completion of the project
Answer:
D: the longest path. This is a definition question for a critical path.
Float is the amount of time an activity may be delayed from its early start without delaying the project completion date.
◦Optimistic time – the shortest time in which the activity can be completed.
◦Most likely time – the completion time having the highest probability.
◦Pessimistic time – the longest time that an activity may take.
Additional Resources
I like the nodes used by Joshua Emmanual in his video above. Don’t feel obligated to use circles in your CPM. Choose what is best for the viewers.
If you need more information on crashing your project, I recommend the three-part video below.