Evaluating the measurement systems (EMP Studies) is an essential step during the product development phase as it impacts the output of the product parameters. Most of the product and process decisions are based on measurement values. Inaccurate measurement values lead to an unnecessary adjustment to the process.
A good measurement system should have certain properties, such as:
- Produce the value which is close to the actual value – Accurate.
- The measurement system should produce almost the same value if we measure the same value repeatedly – Repeatable.
- It should produce consistent values entire range of the object–Linear.
- The measurement system should produce the same value if the different competent operators’ measures – Reproducible.
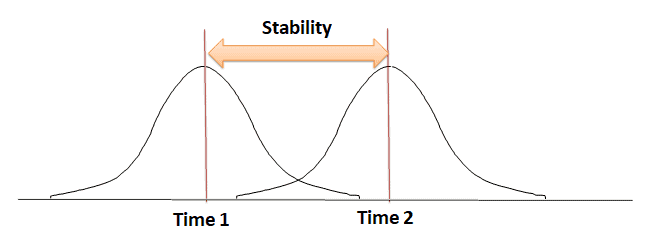
- Capable of producing the same results in the future- Stable
Measurement Systems Terminology
1-Measurement are said to be accurate if their tendency is to center around the actual value of the entity being measured. Measurement accuracy is attained when the measured value has a little deviation from the actual value.
2-Measurement are precise if they differ from one another by a small amount.
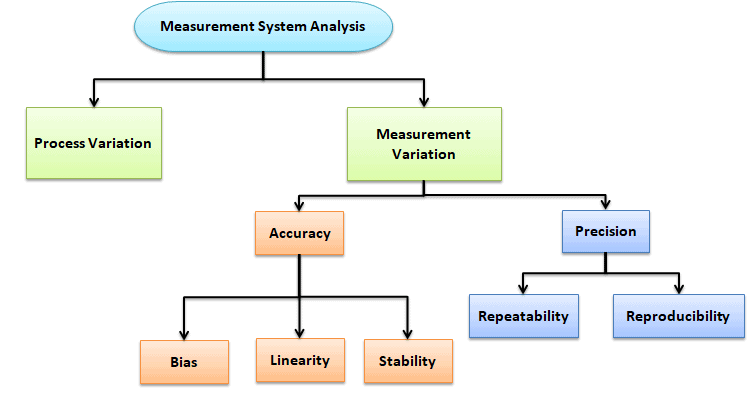
Accuracy
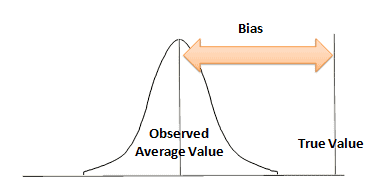
Accuracy is the difference between the true average and the observed average. If the average value differs from the true average, then the system is not accurate. This is an indication of an inaccurate system.

- Bias: Bias is the difference between the observed average measurement to the true or reference value. To measure the Bias first needs to measure the same part number of times and then calculate the average of measurement.
Simply Bias = Average of measurement value – Reference or true value.
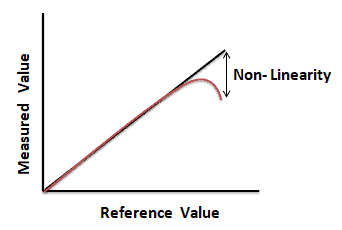
Linearity: Linearity is the difference in Bias value over the normal operating range of the measuring instrument. In other words, it is the change in Bias over the operating range of the measurement equipment.
Stability: Stability refers to the capacity of the measurement system to produce the same values over time when measuring the same sample. In other words, it is the difference in the average of at least 2 sets of measurements with a gage over time. A measurement system is stable if no special cause of variation affects the measurement system bias over time.
Precision
The precision of the measurement system is the degree to which repeated measurements under unchanged conditions show the same result. In other words, precision refers to the closeness of two or more measurements to each other.

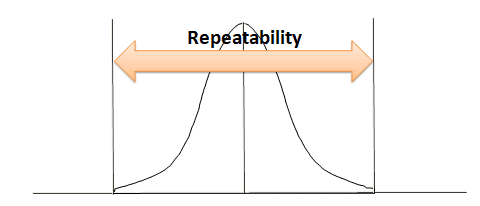
Repeatability: Repeatability is the variation between successive measurements of the same part, same characteristic, by the same person using the same gage. In other words, how much variation do we see in measurements taken by the same person, on the same part, using the same tool?
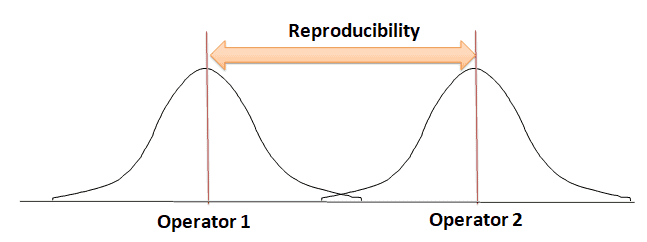
Reproducibility: Reproducibility is the difference in the average of the measurements made by different people using the same instrument when measuring the identical characteristic on the same part. In other words, how much variation do we see in measurements taken by different people on the same part using the same tool?
Source of Variability
There are three main sources of variation that needs to be considered for the measurement system process.
- Measuring instrument (repeatability)
- The operator (reproducibility)
- Time (stability)
The above three variations are to be compared with part-to-part variation. The total variation of the measurement system is small compared to the part-to-part variation.
Multi-Vari chats are often used to summarize the variation of an instrument, operator, and time-to-time variation.
Relationship between Measurement Variations
The relationship between total observed product variations is the sum of characteristic product variation and the variation due to measurement.
σp2 = σc2+ σm2
- Where σp2 =Total observed product measurement variation
- σc2 = Product variation
- σm2 = Measurement system variation
Ratio of measurement system variation to the observed product measurement variation = σm2/ σp2
Evaluating the Measurement Systems (EMP Studies) using Control Chart Method
Evaluating the Measurement Systems, measurement error shows up in the width of the control limits for both the x-bar portion and the range portion.
Prerequisite for Measurement Systems Evaluation
- Firstly, to analyze the results, the team should know the X bar- R chart
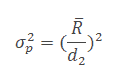
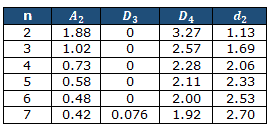
- Secondly, knowledge of how to estimate standard deviation using R bar and d2
- Thirdly, use the rational sub-grouping
- Fourthly, set 3-sigma control limits based on the ranges from subgroups
- Assess the measurement system error
- Make sure to have enough data and measurement increment is adequate
- Finally, determine precision to tolerance ration
Steps to follow for Evaluating the Measurement Systems (EMP Studies)
- Determine the subgroup size (n=3, 4, or 5, etc,) as well as the sampling frequency
- Collect a minimum of 20 to 25 sets of samples in the time sequence
- Compute the average of each subgroup i.e X bar, then measure the grand average of all X bar values, this will be the centerline for the X bar chart
- Compute the range of each subgroup i.e. Range, then measure grand averages of all range values i.e., R bar, and this will be the centerline for the R chart
- The dots display product variation, not measurement error.
- You want most of the points to be out of control on the x-bar portion because the dots show you the product variation, whereas the narrow (ideally) width of the control limits reveals the slope in the measurement system. You want the slope in the measurement system to be less than the variation in the product.
- The MSE study takes pains to minimize the amount of within-piece variation by measuring each of the n parts in exactly the same spot.
- Measurement system bias examines the difference between the observed average measurement and a reference or master value. Moreover, bias has nothing to do with whether or not a measurement device is calibrated.
- DO NOT use a different measurement device for each of the three (or more) operators. You really do not want to introduce additional sources of variation (e.g., other tools) into the study.
Determine the Control Limits :
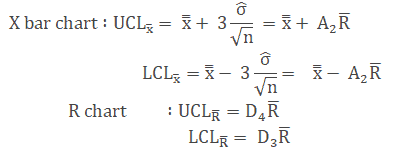
- Where
- X is the individual value (data)
- n is the sample size
- X bar is the average reading in a sample
- R is the Range, in other words, the difference between the largest and smallest value in each sample
- R bar is the average of all the ranges.
- UCL is the Upper control limit
- LCL is a Lower control limit
- From the X bar R chart, the average range helps to determine the total variance of observed product measurement.
- Then, we need to estimate the variance due to the measurement system.
- Collect a minimum of 20 to 25 values from the measurement system and estimate the variance σm2 of the measurement system using an appropriate control chart.
- Finally, estimate the variance due to the measurement system by σm2/ σp2
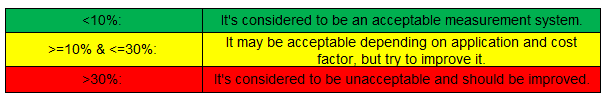
- According to the Automotive Industry Action Group (AIAG), below are the guidelines for measurement system
Evaluating the Measurement Systems (EMP Studies) Example
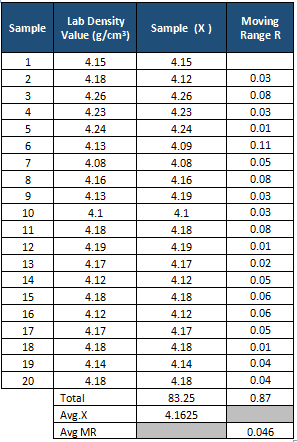
Example: In a manufacturing company, paste density is one of the critical parameters, measuring the paste density(g/cm3)four times in a shift for 20 days. Also, the unit had an in-house lab to test the density of the standard, and they test it for 20 days using the measurement system. Following are the density values at the production area and the lab results for 20 days.
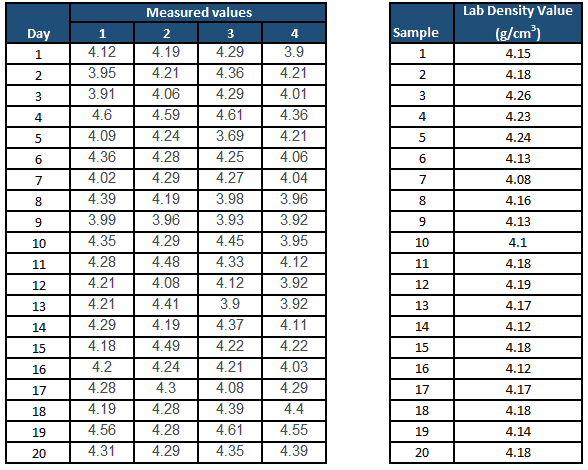
Use X bar R chart for measured values
- Compute the average x bar and R bar values
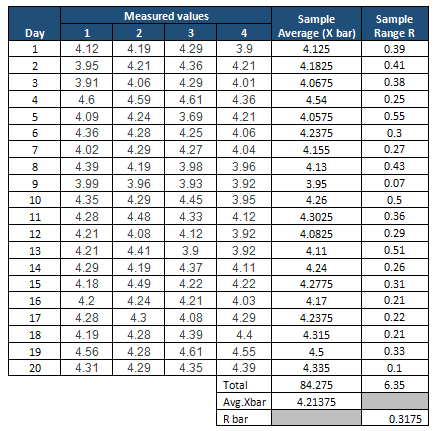
Determine the Control Limits:
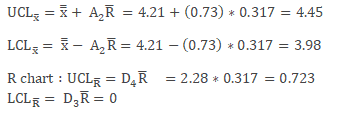

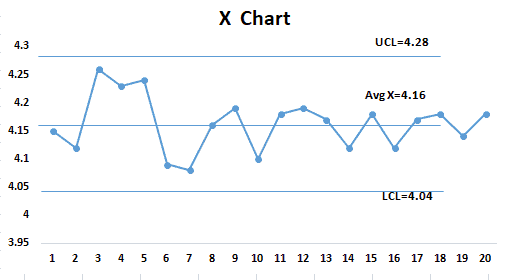
X bar R chart
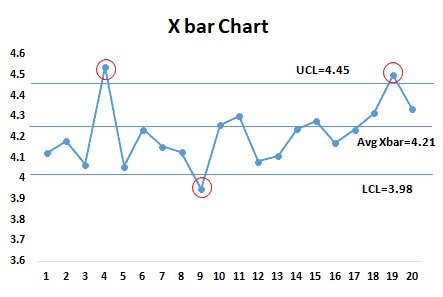
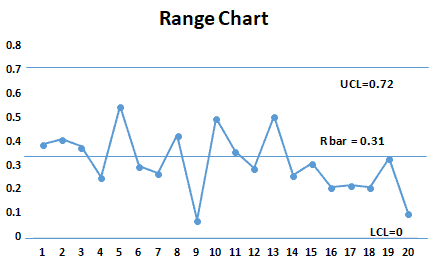
Note: As shown above in the graph, a few points are outside of the control limits in the X bar chart. So it indicates few special causes exist in the process. However, all the points in the Range chart are within limits. Hence we can estimate the product measurement variance from the average range.
Now, analyze the lab results using an individual chart based on the output and then use the moving range to estimate the measurement system variation. The lab is testing the same sample again and again, thus, we can consider the variation is only due to the measurement system.
Compute the average X and moving R values.
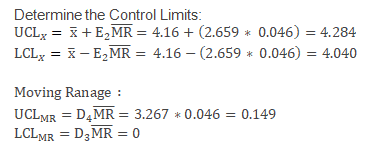
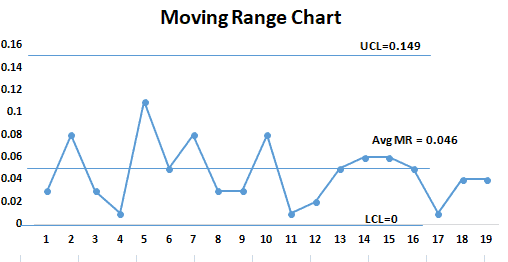
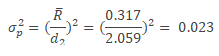
From the above graph, it is clear that all the points are within the control limits. Hence the measurement system is predictable. The variance of the measurement system is
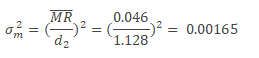
Total variance of the measurement = σm2/ σp2= 0.00165/0.02378= 7%
According to the Automotive Industry Action Group (AIAG), below are the guidelines for measurement system
The SPC-based approach is very useful, visually depicting the variation of the measurement system, and also helps to identify the variation due to product measurement and the variation due to the measurement system.
Also, see Measurement Systems Analysis and Gage Repeatability & Reproducibility
Comments (5)
Hi ted,
I think this area of the BOK isn’t quite to the standard of your other modules. Would really appreciate a review of this area!
Keep up the good work!
Hi Jonathan,
Thanks for the kind words. An update for this article is in the works.
Best, Ted.
Here you go, Jonathan! New article. Would appreciate your thoughts.
Hi Ted,
Really great stuff here and as student on a Degree course for Metrology, this is an excellent and insightful article.
Glad it’s helpful, Alex! Very much appreciate the kind words!