Point and Interval estimates are the two forms of population parameter estimation based on sample data. Point estimation is very easy to compute. However, the interval estimate is a much more robust and practical approach than the point estimate.
What is an Estimation?
Estimation is a process in which we obtain the values of unknown population parameters with the help of sample data. In other words, it is a data analysis framework that combines effect sizes and confidence intervals to plan an experiment, analyze data, and interpret the results.
Furthermore, the basic purpose of estimating methods is to estimate the size of an effect and report the effect size along with its confidence interval.
The estimator is a method, formula, or function that specifically tells how to compute an estimate. In other words, to estimate the value of the population parameter, you can use information from the sample as an estimator.
Properties of Estimators
We use sample measures to estimate the population measures; these statistics are the estimators. Following are the properties of good estimators.
- An estimator should be consistent. For instance, if it is consistent, the estimator value approaches the parameter value estimated as the sample size increases.
- Estimators should be unbiased. In other words, the expected value obtained from the sample is equal to the parameter being estimated. Otherwise, the estimator is biased.
- The estimator should be efficient. In other words, it should have a minimal variance from the actual variance of the estimator.
Variables
- x: The individual value
- X̅: A point estimate for the population mean
- σ: The actual population standard deviation/symbol for the measurement of dispersion in a population
- n: The statistic for the number of data in a sample
- N Is for populations
- X̿:(double bar): The grand average of the subgroup averages. AKA X-bar bar or X-double bar
- s (or sd): The sample standard deviation is a point estimate for the population standard deviation / the dispersion statistic for samples
- µ: The central tendency statistic for populations
Also, see Types of Statistics
Types of Estimation
Estimators are two different types:
- Point Estimates
- Interval Estimates
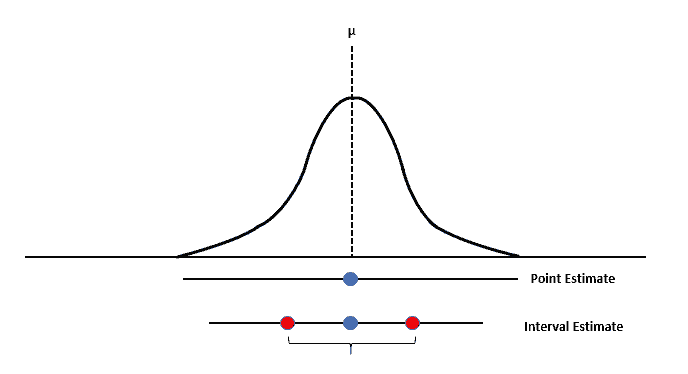
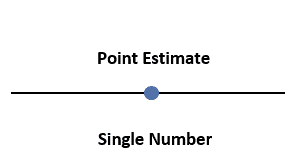
Point Estimates
A point estimate is a sample statistic calculated using the sample data to estimate the most likely value of the corresponding unknown population parameter. In other words, we derive the point estimate from a single value in the sample and use it to estimate the population value.
For instance, if we use a value of x̅ to estimate the mean µ of a population.
x̅ = Σx/n
For example, 62 is the average (x̅) mark achieved by a sample of 15 students randomly collected from a class of 150 students, which is considered the mean mark of the entire class. Since it is in the single numeric form, it is a point estimator.
The basic drawback of point estimates is that no information is available regarding their reliability. In fact, the probability that a single sample statistic is equal to the population parameter is very unlikely.
Take a sample, find x̅. x̅ is a close approximation of μ. But, depending on your sample size, that may not be a good point estimate. For instance, ‘s’ is a good approximation of ‘σ.’ So, if we want stronger confidence in our estimate range, we need to do a confidence interval.
Interval Estimates
A confidence interval estimate is a range of values constructed from sample data so that the population parameter will likely occur within the range at a specified probability. Accordingly, the specified probability is the level of confidence.
- Broader and probably more accurate than a point estimate
- Used with inferential statistics to develop a confidence interval – where we believe with a certain degree of confidence that the population parameter lies.
- Any parameter estimate that is based on a sample statistic has some amount of sampling error.
In statistics, interval estimation uses sample data to calculate an interval of possible values of an unknown population parameter.

Below are the factors that determine the width of a confidence level:
- Sample size
- Population variability
- Desired level of confidence
Confidence Interval
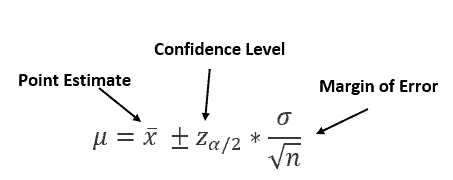
A Confidence interval is used to express the precision and ambiguity of a particular sampling method. Additionally, the confidence interval equation consists of 3 parts.
A confidence interval is a range of values that probably contain the population mean.
A Confidence level is a percentage of certainty that, in any given sample, that confidence interval will contain the population means.
The Point estimate is a statistic (value from a sample) used to estimate a parameter (value from the population).
The margin of error is the maximum expected difference between the actual population parameter and a sample estimate of the parameter. In other words, it is the range of values above and below sample statistics.
Interval Estimates Examples
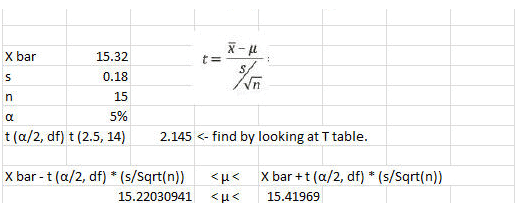
Example 1:
A large company conducted a series of tests to determine how much data individual users stored on the file server. So, a random sample of 15 users revealed an average of 15.32 GB with a standard deviation of 0.18 GB. What is the interval that contains the actual company user average?
Example 2:
A plastic injection molding company is trying out a new dye. So, based on a sample of 25 trials, the average cycle time was 7.49 seconds with a standard deviation of 0.22 seconds. However, this machine’s known process variance is 0.0576. Find the confidence limits of µ. Test at the 99% confidence level.

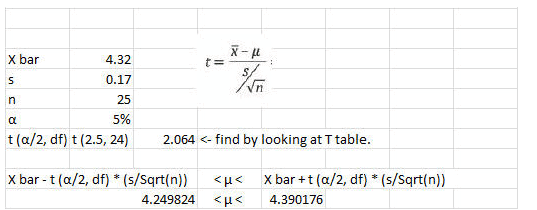
Example 3:
The mean length of the 25 parts plastic injection molding process is 4.32 cm with a standard deviation of 0.17 cm. What is the 95% confidence interval for the actual mean of this process?
Comments (4)
Very helpful. I want more details about estimation.
Hi Abu,
Thank you for the comment. Could you tell me what specific details you’re looking for?
Best, Ted.
Hello ted,
This information about estimation is very helpful. Can you connect this interval estimator discussion to a probability measure, Lebesgue measure, and ergodic measure?
Thank you.
Best. Teotima
Hi Teotima,
Thanks for the suggestion. I may expand there in the future. For now, this isn’t required for Six Sigma certification so it will be a lower priority behind serving my clients. But perhaps one day.
Best, Ted.