Process control for non-normal data involves monitoring and managing industrial or operational processes that produce non-normally distributed data. Non-normal data, also referred to as non-normally distributed data, are data points that do not follow a normal distribution or Gaussian distribution.
The objectives of process control remain the same as traditional process control: ensuring consistent product quality, minimizing defects, and maintaining stable production. However, when dealing with non-normal data, specific techniques and strategies are employed to effectively manage the process.
What is non-normal data?
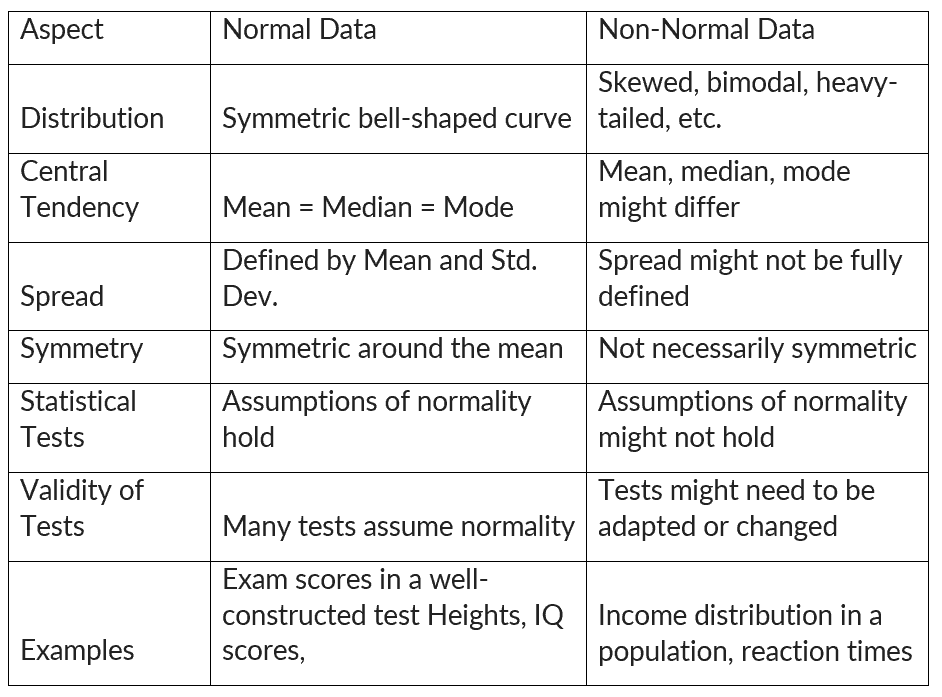
Non-normal data refers to data that deviates from a normal distribution. A normal distribution is a bell-shaped curve that is symmetrical around the mean. Non-normal data can be skewed (asymmetrical) or have outliers (extreme values).
When data doesn’t adhere to the characteristics of a normal distribution, it implies potential skewness or the presence of other distinct patterns. Such non-normal data can notably influence statistical analyses that presume a normal distribution, like t-tests or ANOVA (analysis of variance).
How to identify non-normal data
Identifying non-normal data involves examining the distribution of data and looking for patterns that deviate from the characteristics of a normal distribution.
Visual Inspection:
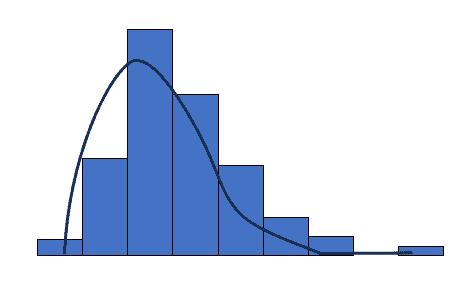
Histogram: Histogram is a bar chart showing the number of times an outcome is repeated. Create a histogram and observe its shape. Look for skewed distributions, multiple peaks, or irregular patterns.

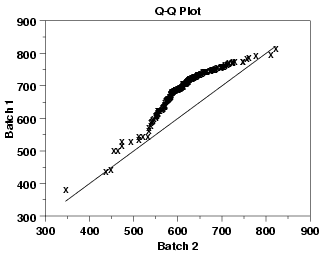
Q-Q Plot (Quantile-Quantile Plot): This plot compares the quantiles of data with the quantiles of a normal distribution. If the points deviate significantly from a straight line, the data might not be normal.
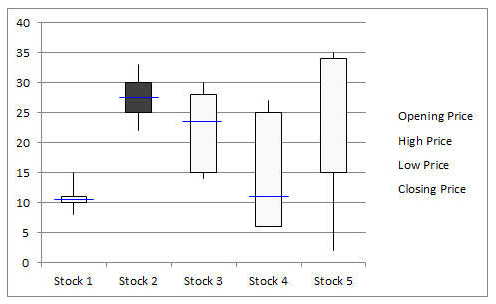
Box Plot: Box plots are used in statistics to graphically display various parameters at a glance. It helps to identify skewness and the presence of outliers.
Summary Statistics:
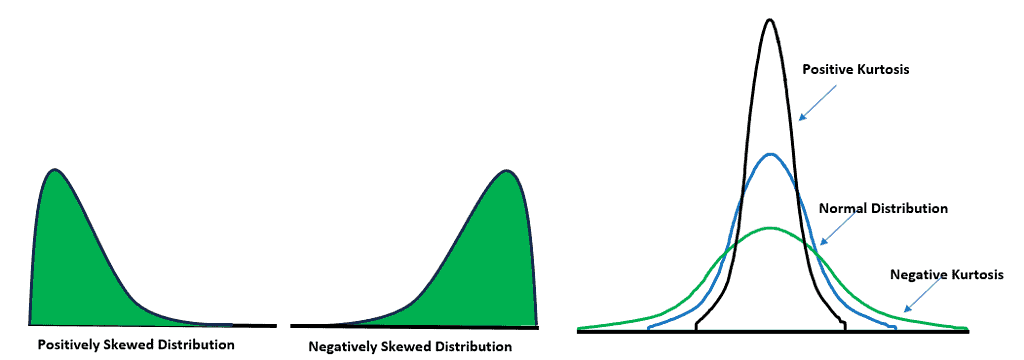
Skewness and Kurtosis: Calculate skewness and kurtosis values. Positive skewness and kurtosis values that deviate significantly from 0 and 3, respectively, can indicate non-normality.
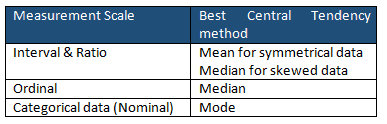
Mean and Median: The median is the middle value when the data is arranged in ascending or descending order. If the mean and median significantly differ, it might suggest non-normality.
Statistical Tests:
Shapiro-Wilk Test: This test assesses the normality of data. If the p-value is below a certain threshold (e.g., 0.05), you might conclude that the data is not normally distributed.

Kolmogorov-Smirnov Test: Similar to the Shapiro-Wilk test, this test assesses the goodness of fit between the data and a normal distribution.
Sample Size:
With larger sample sizes, easy to detect deviations from normality that might not be noticeable with smaller samples. However, it’s important to consider the context and the practical significance of any deviations.
Why transform non-normal data into normal
Data transformation is a process of modifying the distribution of non-normal data to make it more closely resemble a normal distribution. This can be done using a variety of transformation techniques, such as the logarithmic transformation, the square root transformation, and the Box-Cox transformation.
Transformed data also tend to exhibit more symmetric distributions, rendering them more interpretable and facilitating clear communication of findings. Additionally, when comparing data across different groups or conditions, data transformation supports more meaningful and valid comparisons. However, it’s important to note that data transformation cannot guarantee the attainment of normal distribution. Also, the interpretation of transformed data can be less intuitive.
When to transform non-normal data to normal
- For statistical tests or models that rely on the assumption of normality (e.g., t-tests, ANOVA, linear regression), and when the data significantly deviates from normality, data transformation can be employed to align with the assumption and enhance the validity of the results.
- If the data contains extreme outliers that are influencing analyses, transformation can reduce their impact and help you focus on the underlying patterns in the data.
- In the context of regression analysis, transforming the response variable (dependent variable) can help ensure that the residuals (the discrepancies between observed and predicted values) adhere to a normal distribution.
- In cases where the variance of the data is not constant across groups or conditions (heteroscedasticity), transforming the data can help stabilize the variance, making statistical tests more reliable.
- When the data is highly skewed (either positively or negatively), and this skewness is problematic for your analysis, transformation can make the data more symmetric.
- For quality control settings, transforming data might be necessary to meet the assumptions of control charts or other quality control methods.
How to convert non-normal data to normal
- Visual Assessment: Plot histograms, Q-Q plots, and other graphs to understand the initial distribution and identify the type of skewness.
- Select Transformation: Based on the distribution characteristics, choose an appropriate transformation technique.
- Apply Transformation: Apply the chosen transformation to the data. Be cautious with zero or negative values, as some transformations might not be suitable.
- Assess Normality: After transformation, re-assess normality using the same techniques as before. Use statistical tests or visual comparisons.
- Analysis: If the data is now closer to normality, then perform the desired analysis. If not, have to explore other transformation methods or consider using non-parametric methods.
Different transformation techniques
- Logarithmic Transformation: Apply the natural logarithm (ln) to the data to approximate a normal distribution. This transformation is effective for positively skewed data and is particularly useful when dealing with data that span multiple orders of magnitude.
- Box-Cox Transformation: The Box-Cox transformation encompasses a range of power transformations, including logarithmic, square root, and reciprocal transformations. By estimating a parameter (lambda) that maximizes normality, this method can be applied to data with both positive and negative skewness. The applicable formula is yl =yλ (λ is the power or parameter to transform the data). For instance, λ=2, the data is squared, and if λ=0.5, then a square root is required.
- Square Root Transformation: Apply a square root transformation to the data to achieve normality. This method is suitable for data with moderate skewness, such as count data or data containing small positive values.
- Reciprocal Transformation: Apply the reciprocal (1/x) to the data to transform it toward a normal distribution. This technique is beneficial for data that exhibits negative skewness, especially when dealing with data that includes large values.
- Exponential Transformation: Utilize the exponential function (e^x) to improve the quality and normality of the data. The exponential transformation is advantageous for data with a left-skewed distribution, enhancing data usability.
Enacting Process Control with Non-normal Data
When dealing with non-normal data in process control, it’s essential to tailor the control strategies to the unique characteristics of the data distribution. Understand the specific features of the non-normal distribution, such as skewness or outliers.
Control charts, like the X-bar R chart, assume normality. However, for non-normal data, consider alternatives like individual control charts and median control charts that are explicitly designed for non-normal distributions. Additionally, data transformation can be an option if the data exhibits slight skewness or specific patterns.
Furthermore, when non-normal data consistently exceed the control limits, it’s essential to engage in process improvement efforts. Utilize structured frameworks like DMAIC (Define, Measure, Analyze, Improve, Control) to address root causes and enhance process stability. Also, continuously monitor and evaluate the control methods, adjusting the strategies as needed to ensure effective management of non-normal data for improved process stability and product quality.
Advantages of non-normal data
- In real life, data often does not follow a perfect bell curve. Non-normal data is better at capturing the complex and diverse nature of real data.
- Some statistical tests and methods are robust to deviations from normality. This means that they can still produce accurate results even when the data does not follow a normal distribution.
- Non-normal data can reveal potential outliers or anomalies that might be hidden in normally distributed data.
- Non-normal data can exhibit a wide variety of patterns, such as bimodal or multimodal distributions. This can help us to gain a richer understanding of the data.
- The complexities of non-normal data may require the use of specialized statistical techniques. However, these techniques can ultimately lead to more accurate results.
Disadvantages of non-normal data
- Many common statistical tests, like t-tests and ANOVA, assume a normal distribution for the data. Dealing with non-normal data can compromise the validity of these tests.
- Using tests that assume normality on non-normal data can lead to wrong conclusions, such as false positives or false negatives.
- The presence of non-normal data can make it more difficult to estimate parameters accurately.
- Non-normal data, especially when it is skewed, can lead to inaccurate inferences about the population.
- Applying statistical tests to non-normal data can reduce their effectiveness. This means that they may not be able to detect significant differences or relationships.
- Interpreting statistical results derived from non-normal data can prove more challenging. This arises because the results may lack intuitiveness and tend to be more complex.
- Data transformations can sometimes help to make non-normal data more normally distributed. However, this is not always possible.
- Non-normal data is more susceptible to the influence of outliers. This means that outliers can have a greater impact on the results of statistical analyses.
- Non-normal data may require the use of more complex modeling techniques in order to effectively capture the underlying patterns.