The program (or project) evaluation and review technique (PERT) is a statistical tool we can use to plan and analyze project tasks.
What is Included in a PERT?
You need to include the following items in a PERT:
- Every task is required to bring the project to a state of completion.
- The amount of time required for each task.
- The sequence required for the tasks.
- Phases of the project.
- Completion points for each phase in the project.
Optional items:
- Critical path
Sample PERT Chart

Pros and Cons of PERT Charts
Pros
- Making the diagram can unveil dependencies, bottlenecks, and problem areas.
- Your chances of meeting a deadline can be calculated.
- Much easier to meet a deadline because you can see alternative plans.
- Easy to evaluate changes to the plan.
- Large amount of data, simply displayed.
Cons
- May create implementation problems due to complexity.
- More data is needed to create this compared to a Gantt chart.
PERT vs GANTT
PERT and Gantt charts contain similar information. They can be used for similar purposes. However, you’ll find that in many situations, you’re better off using one or the other. Here’s how to tell which you need.
Use a Gantt chart if:
- Your primary focus is managing resources and team members.
- You want to see an overview of the project schedule at a glance.
- The project is fairly simple in structure.
Use a PERT chart if:
- You want to find a critical path.
- The project is complex in structure and contains many dependencies.
- Your main focus is the timing of the project.
- Being able to quickly see and understand dependencies is important.
How to Create a PERT Chart
- Identify the milestones that your project needs.
- Figure out the tasks required to make those milestones happen.
- Look for dependencies between those tasks. Which can’t be started or completed until other tasks are finished? A mind map with arrows is often a good tool to use for this.
- Plot out the PERT chart, starting with tasks that have no dependencies, through to the completed project.
- Mark milestones.
- Estimate times for each task. Typically you’ll want at least three estimates (sounds excessive, but stick with us):
- Optimistic: everything works perfectly, and you have all the resources you need to complete the task. There are no progress blockers.
- Most likely: a realistic estimate based on the probabilities of the optimistic and pessimistic situations actually happening.
- Pessimistic: everything that can go wrong does go wrong. Progress blockers galore. This is the worst-case scenario.
- Calculate an expected time for each task using the following formula:
(O + (4*M) + P) / 6
Where:
O = optimistic estimate
M = most likely estimate
P = pessimistic estimate - Add up the expected times for each task to come up with an expected time for the entire project.
- (Optional) Identify your critical path: the tasks that must be completed if the project is functional. Mark these tasks and any tasks they’re dependent upon.
- (Optional) Add up the expected times for each task on the critical path to come up with an expected time for the critical components of the project.
Most likely: further exploration
It might seem obvious to average your optimistic and pessimistic estimates to find your most-likely estimate. However, this often isn’t a great idea. Both pessimistic and optimistic estimates are frequently based on unlikely (but possible!) scenarios. You need to take into account just how likely they are.
For example, say you’re estimating making a burger. Your pessimistic estimate assumes that you’ll need to slice and prepare every ingredient yourself because you’ve run out of the prepared ingredients. Your optimistic estimate assumes that everything is ready and you have to slap the ingredients together and add sauce.
Which of the above scenarios is most likely?
In most well-run burger joints, you’d only encounter the pessimistic situation in peak periods. The rest of the time, the optimistic is far more likely. So you’d take that into account when deciding on a most-likely estimate. You’d make it closer to the optimistic than the pessimistic estimate.
Example of Creating a PERT
Let’s run through an oversimplified example scenario for a PERT chart. We’ll take the burger example above and turn it into one of the tasks in our project.
Scenario: A burger joint has a big order to complete and needs to give the customer an estimate of how long it will take. The order consists of fifty burgers, twenty extra-large fries, and fifty shakes.
Milestones
For a project this simple, the only important milestone is the finished product: an assembled order.
Tasks
The manager breaks down the order into these tasks:
- Check ingredient supplies
- Prepare ingredients
- Grill burger patties
- Assemble burgers
- Cook fries
- Prepare shakes
- Assemble order
Dependencies
The manager finds the following dependencies and plots them at the beginning of a PERT chart:
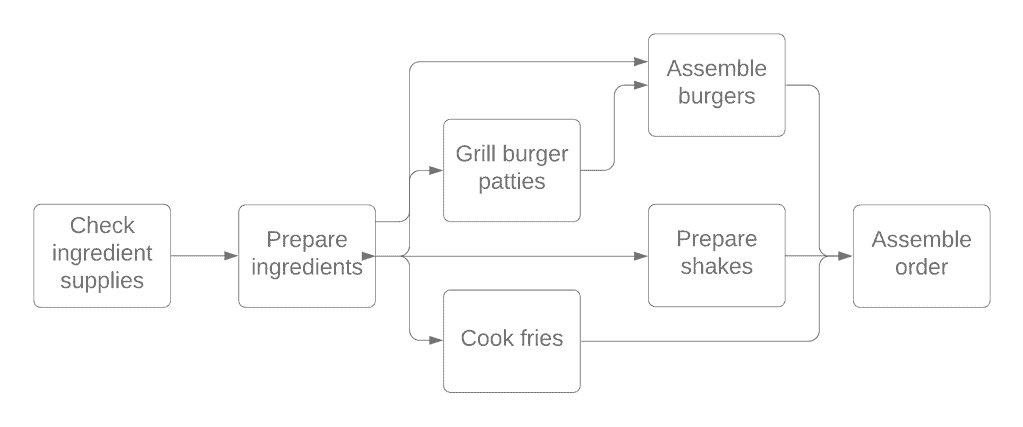
Time estimates
Next, the manager estimates the times for each task.
- Check ingredient supplies: 10 minutes (M), 5 minutes (O), 30 minutes (P)
- Prepare ingredients: 30 minutes (M), 20 minutes (O), 40 minutes (P)
- Grill burger patties: 20 minutes (M), 15 minutes (O), 30 minutes (P)
- Assemble burgers: 20 minutes (M), 10 minutes (O), 40 minutes (P)
- Cook fries: 10 minutes (M), 8 minutes (O), 20 minutes (P)
- Prepare shakes: 40 minutes (M), 30 minutes (O), 50 minutes (P)
- Assemble order: 10 minutes (M), 5 minutes (O), 20 minutes (P)
Expected times
Then they calculate the expected time for each task:
- Check ingredient supplies: (5 + (4*10) + 30) / 6 = 12.5 minutes
- Prepare ingredients: (20 + (4*30) + 40) / 6 = ~27 minutes
- Grill burger patties: (15 + (4*20) + 30) / 6 = ~21 minutes
- Assemble burgers: (10 + (4*20) + 40) / 6 = ~22 minutes
- Cook fries: (8 + (4*10) + 20) / 6 = ~11 minutes
- Prepare shakes: (30 + (4*40) + 50) / 6 = 40 minutes
- Assemble order: (5 + (4*10) + 20) / 6 = ~11 minutes
And add these up to come up with an estimated total for staff hours for the project:
Total staff minutes = 12.5 + 27 + 21 + 22 + 11 + 40 + 11) = 144.5
Total staff hours = 2:25.5
Helpful Links relating to PERT Charts
The Ultimate Guide…PERT Chart