Visual factory is a Lean concept that offers much to Six Sigma, too. We use it to communicate information quickly and easily.
What is it?
A visual factory uses graphics like charts, infographics, and icons to convey key information. For example, say you run a team in a small factory. Turnover is high because a lot of your employees are working through college. So you must ensure that new staff knows where to go and what to do. You can use the visual factory concept to clearly label each work area, provide simple maps of the facility, and give basic instructions for each workstation.
Visual Factory vs. Manuals
This might sound an awful lot like an employee manual. While the information conveyed is similar, though, the method differs substantially. Manuals tend to rely a lot on text. Lots of words! Many people struggle to learn effectively from manuals because they experience the ‘wall of text’ phenomenon: a page of words just becomes a huge learning barrier.
Visual factory modifies the flow of information by making the chunks of data smaller and making them easier to ingest. You’ll find that most people learn more easily from simple graphics than from a few paragraphs of text that explain the same concept. But not only do they learn more easily–they also tend to learn faster. And this is why Visual Factory is such a key part of Lean methodology.
Visual Factory and Lean
Lean methodology is all about removing waste to improve processes and productivity. Visual Factory helps companies to achieve these aims by:
- Offering a faster learning experience.
- Providing just-in-time reminders for key information.
- Allowing staff to take in updates with a glance.
Graphic Uses
There are a number of purposes for which we can use Visual Factory. Here are a few of the most common:
- Process metrics: These deliver information about a process. This might be the current stage of the process or information about a stage in the process. For example, a graphic that displays the current temperature of a kiln vs. the ideal temperature. Process metrics are often delivered electronically to allow rapid, automated updates.
- Warnings: These warn staff about safety threats in the vicinity. They are typically action based. It’s more effective to use instructions on countering the threat than to simply warn about it. For example, consider the difference between a “Hazardous Chemicals” warning and a “Hazardous Chemicals – Put on your HAZMAT suit!” warning.
- Instructions: These remind staff about how to complete a job. For example, an infographic might list the five steps needed to safely use a lathe.
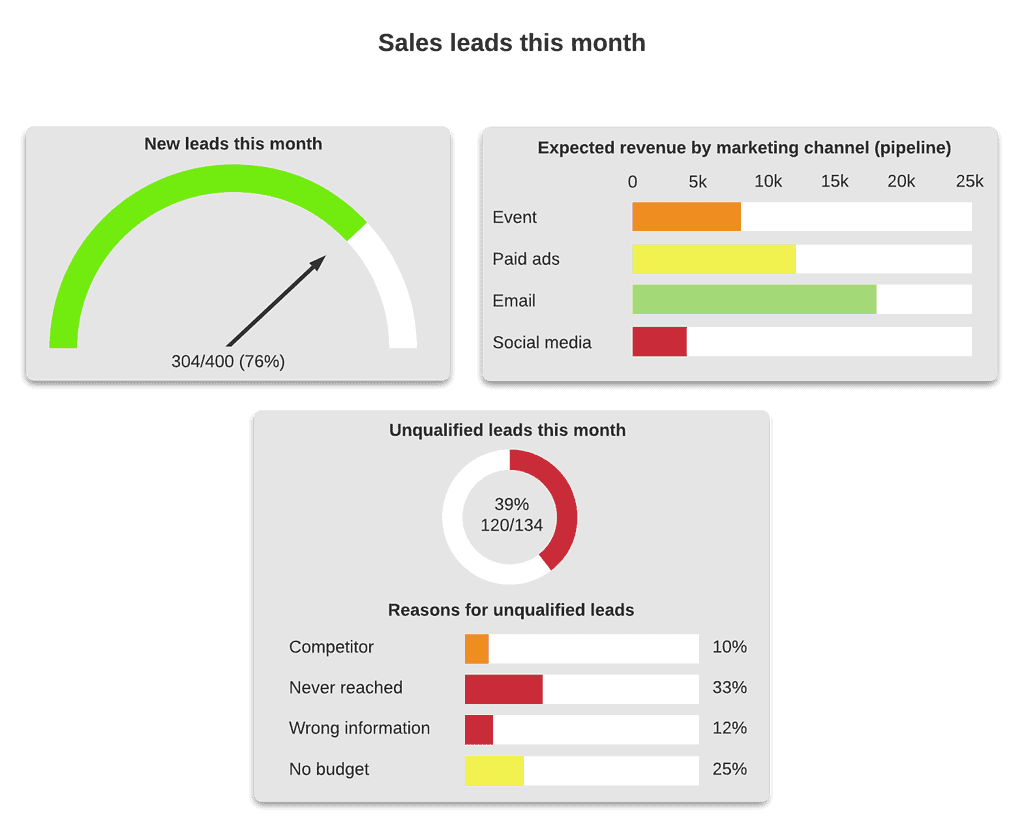
- General information: Project updates, work site maps, company information, etc. These can all be displayed so that they’re quickly and easily understood. Dashboards are a common display mechanism for this type of information.
Implementing Visual Factory
You’ll find that implementing Visual Factory is a process that you refine rather than something you do once and forget about. That’s because every workplace needs to find the best measures for its staff.
A standard DMAIC process is a good approach.
Define
What’s your company’s current situation? For example:
- What are your current methods of information sharing?
- How do you onboard new employees?
Measure
What are you putting into the information-sharing process, and what are you getting out?
- How much time, per employee, is your company spending on training?
- How many resources (people, money, computers, etc.) is your company using, per employee, to train people?
- What other information-sharing activities are going on? For example, daily stand-up meetings and weekly team meetings.
- Are there incidents (for example, accidents) directly attributable to a lack of training or information?
Analyze
Is your company sharing information as efficiently and effectively as it could? Generally speaking, the answer will be no–there’s always room for improvement. Ask questions like:
- What do staff need to know to do their jobs more efficiently?
- How can I get that information to them more quickly and effectively?
- Where are some knowledge gaps where people just aren’t getting the information they need on time?
Improve
You don’t necessarily need to overhaul your entire system at once. You can find one area where a knowledge gap is causing incidents and add Visual Factory aids to improve staff understanding and memory.
Control
Look at what worked and what didn’t in the Improve phase. Compare metrics now with metrics from the Measure phase. Decide what to keep, what to discard, and what to build on. Designate a team to keep up the momentum and continue implementing Visual Factory.
Visual Factory Videos
ASQ Six Sigma Black Belt Certification Exam Visual Factory Questions
Question: Which of the following is a component of a visual factory?
(A) Product specifications
(B) Zero defect policies
(C) Just-in-time policies
(D) Equipment service manual
Answer:
A: Product Specifications. This is really the best option that could be expressed visually.
Comments (6)
Why isn’t the Service Manual a visual component?
Good question, Minor. I agree that many parts of the service manual will have visual components. I think this is one of those examples of a question having more than one right answer and you have to pick the best one.
The ASQ Black Belt practice exam lists product specifications as the correct answer I think because they can be conferred as a short, quick visual reference.
Why are the policies not the right option? zero defect policy and just in time can also be displayed.
Hey Swathi. This is a good question and I understand why you see that policies would be a sufficient answer. While they could be certainly visual, the main purpose visual facotry activities would be to facilitate zero defect and just in time outcomes. Policies alone cannot do this, but specification limits (voice of the customer) posted in front of, lets say a mill operator, is a constant reminder of an exact quality characteristic that will lead to compliance of broad brush policies, such as zero defect. A good example of visual factory elements that would lead to compliance of just in time (JIT) policies would be product takt times needed to favorably impact material ordering and final product delivery. I hope this helps!
How to implement in line report option in Activities?
Hi Shavet,
I’m afraid I do not understand your question, could you elaborate?
Best, Ted.