A tailed hypothesis tests is an assumption about a population parameter. The assumption may or may not be true. Hypothesis testing is a key procedure in inferential statistics used to make statistical decisions using experimental data. It is basically an assumption that we make about the population parameter.

Null and alternative hypothesis
Null hypothesis (H0): A statistical hypothesis assumes that the observation is due to the chance factor. In other words, the null hypothesis states that there is no (statistical significance) difference or effect.
Alternative hypothesis (H1): The complementary hypothesis of the null hypothesis is an alternative hypothesis. In other words, the alternative hypothesis shows that observations are the results of a real effect.
What are the tails in a hypothesis test?
A tail in hypothesis testing refers to the tail at either end of a distribution curve. Generally, in hypothesis tests, test statistic means to obtain all of the sample data and convert it to a single value. For example, Z-test calculates Z statistics, t-test calculates t-test statistic, and F-test calculates F values etc., are the test statistics. Test statistics need to compare to an appropriate critical value. A decision can then be made to reject or not reject the null hypothesis.
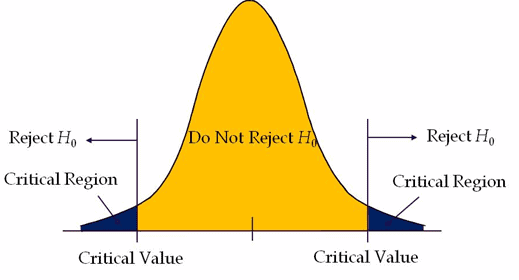
In probability distribution plots, the shaded area in the plot (one side in one-tailed hypothesis and two sides in a two-tailed hypothesis) indicates the probability of a value falls within that range.
Critical region: In a hypothesis test, critical regions are ranges of the distributions where the values represent statistically significant results. If the test statistic falls in the critical region, reject the null hypothesis.
Types of tailed hypothesis tests
There are three basic types of ‘tails’ that hypothesis tests can have:
- One-tailed test
- Right-tailed test: where the alternative hypothesis includes a ‘>’ symbol.
- Left-tailed test: where the alternative hypothesis includes a ‘<’ symbol.
- Two-tailed test: where the alternative hypothesis includes a ≠.
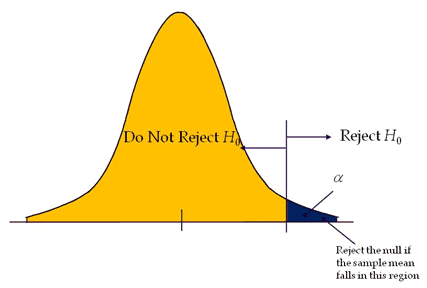
One-tailed hypothesis tests
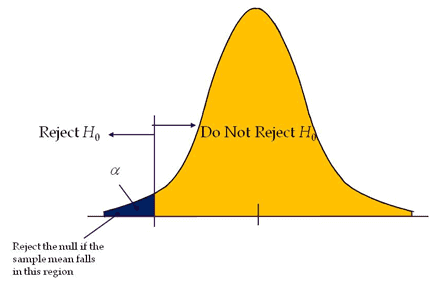
A test of hypothesis where the area of rejection is only in one direction. In other words, when change is expected to have occurred in one direction, i.e expecting output either increase or to decrease.
If the level of significance is 0.05, a one-tail test allots the entire alpha (α) in the one direction to test the statistical significance. Since the statistical significance in the one direction of interest, it is also known as a directional hypothesis.
Reject the null hypothesis; If the test statistic falls in the critical region, that means the test statistic has a greater value than the critical value (for the right-tailed test) and the test statistic has a lesser value than the critical value (for the left tailed test).
Generally, one-tailed tests are more powerful than two-tailed tests; because of that, one-tailed tests are preferred.
The basic disadvantage of a one-tailed test is it considers effects in one direction only. There is a chance that an important effect may miss in another direction. For example, a new material used in the production and checking whether the yield improved over the existing material. There is a possibility that new material may give less yield than the current material.
One tailed tests are further divided into
- Right-tailed test
- Left-tailed test
Right-tailed test
Right tailed test is also called the upper tail test. A hypothesis test is performed if the population parameter is suspected to be greater than the assumed parameter of the null hypothesis.
- H0: The sampling mean (x̅) is less than are equal to µ
- H1: The sampling mean (x̅) is greater than µ.
Example: The average weight of an iron bar population is 90lbs. Supervisor believes that the average weight might be higher. Random samples of 5 iron bars are measured, and the average weight is 110lbs and a standard deviation of 18lbs. With a 95% confidence level, is there enough evidence to suggest the average weight is higher?
- Population average score (µ) = 90
- Sample average (x̅) = 110
- s =18
- number of samples (n) = 5
- Level of significance α=0.05
H0: The average weight is equal to 90, µ=90.
H1: The average score is higher than 90, µ>90
Since supervisor is keen to check the average weight is higher, it is a right-tailed test.
α=0.05
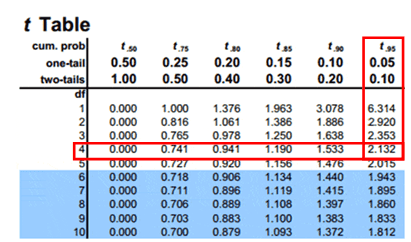
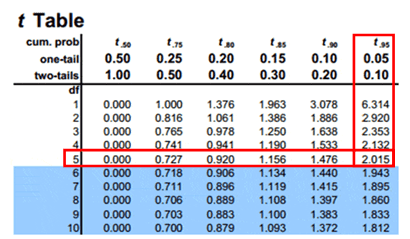
Compute the critical value: For 95% confidence level t value with a degrees of freedom n-1= 2.132
Critical value =2.132
Calculate the test statistics t = x̅-µ/(s/√n) = 110-90/(18/√5)=2.484.
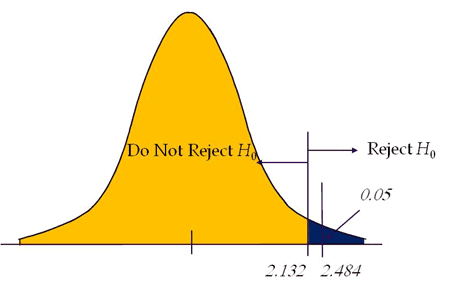
Conclusion: Test statistic is greater than the critical value, and it is in the rejection region. Hence, we can reject the null hypothesis. So the average weight of the iron bar is may be higher than the 90lbs.
Left-tailed test
Left-tailed test is also known as a lower tail test. A hypothesis test is performed if the population parameter is suspected to be less than the assumed parameter of the null hypothesis.
- H0: The sampling mean (x̅) is greater than are equal to µ
- H1: The sampling mean (x̅) is less than µ.
Example: The average weight of an iron bar population is 90lbs. Supervisor believes that the average weight might be lower. Random samples of 6 iron bars are measured, and the average weight is 82lbs and a standard deviation of 18lbs. With a 95% confidence level, is there enough evidence to suggest the average weight is lower?
Population average score (µ) = 90
- Sample average (x̅) = 82
- s =18
- number of samples (n) = 6
- Level of significance α=0.05
H0: The average weight is equal to 90, µ=90.
H1: The average score is less than 90, µ<90
Since the supervisor is keen to check the average weight is lower, hence it is a left-tailed test.
α=0.05
Compute the critical value: For 95% confidence level t value with a degrees of freedom n-1= -2.015
Critical value =-2.015
Calculate the test statistics t = x̅-µ/(s/√n) = 82-90/(18/√6)=-1.088
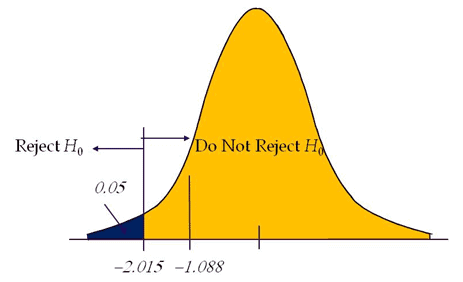
Conclusion: Test statistic is not in the rejection region. Hence, we failed to reject the null hypothesis. So the average weight of the iron bar is 90lbs.
Two-tailed hypothesis tests
A test of hypothesis where the area of rejection is on both sides of the sampling distribution.
If level of significance is 0.05 of a two-tailed test, it distributes the alpha (α) into two equal parts (α/2 & α/2) on both sides to test the statistical significance.
- H0: The sampling mean (x̅) is equal to µ
- H1: The sampling mean (x̅) is not equal to µ
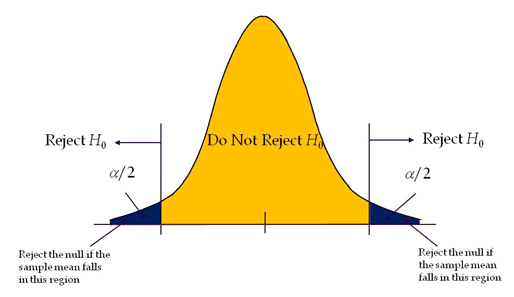
Two-tailed tests also known as two-sided or non-directional test, as it tests the effects on both sides. In a two-tailed test, extreme values above or below are evidence against the null hypothesis.
Reject the null hypothesis if test statistics fall on either side of the critical region.
Example: The average score for the mean population is 80, with a standard deviation of 10. With a new training method, the professor believes that the score might change. Professor tested randomly 36 students’ scores. The average score of the sample is 88. With a 95% confidence level, is there enough evidence to suggest the average score changed?
Population average score (µ) = 80
- Sample average (x̅) = 88
- σ =10
- number of samples (n) = 36
- Level of significance α=0.05
H0: The average score is equal to 80, µ=80.
H1: The average score is not equal to 80, µ≠80
Since the professor is keen to check the change in average score, it is a two tail test
α/2=0.025
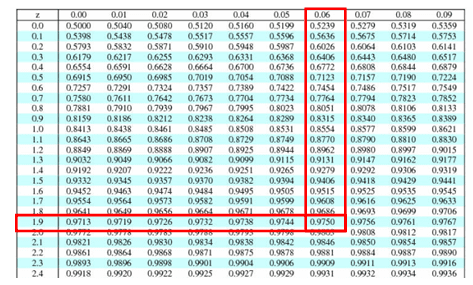
Compute the critical value: For 95% confidence level Z value = 1.96
Critical value =±1.96
Calculate the test statistics Z = x̅-µ/(σ/√n) = 88-80/(10/√36)=4.8
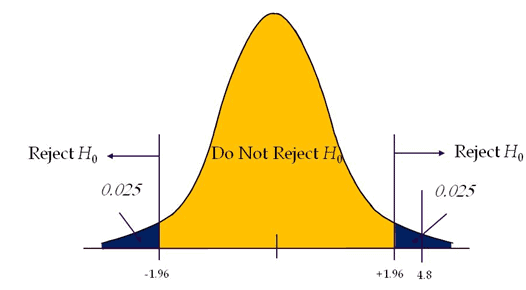
Conclusion: The test statistic is greater than the critical value, which means the test statistic is in the rejection region. So, we can reject the null hypothesis.
Few more Example
For Example, consider a null hypothesis that states that cars traveling on a particular road have a mean velocity of 40 miles/hour:
- A right-tailed test would state that cars traveling on a particular road have a mean velocity greater than 40 miles/hour.
- A left-tailed test would state that cars traveling on a particular road have a mean velocity less than 40 miles/hour.
- A two-tailed test would state that cars traveling on a particular road have a mean velocity greater than or less than 40 miles/hour.
Comments (8)
I believe you have the right tail and left tails mixed up in this article. It conflicts with other articles you have written and also with my separate findings. In general, the right tailed test is when the alternative hypothesis is > null hypothesis. Putting you on the right side of the bell curve, hence the “right tailed” name.
You’re absolutely correct, Montgomery. The article has been updated. Thanks for bringing this to my attention!
Good Day Ted,
Just brushing up a little while on my break at work. Has the following below been updated yet? When looking at an actual graph it’s otherwise.
-When performing a right-tailed test, we reject the null hypothesis if the
test statistics are less than the critical value.
-When performing a left-tailed test, we reject the null hypothesis if the
test statistics are greater than the critical value.
We should be all set now with our current re-write, Lemarcus.
Thank you for the note!
What is the difference btw z statistic and t statistic ?
I have seen on your content that, for a right tailed test
For Z statistic, reject null hypothesis if p value is less than critical value
For t statistic, reject null hypothesis if t value is more than critical value
Also, in the two-tailed test, you chose Z instead of t statistic. Why ?
Hello Rahul,
Reject the null hypothesis; If the test statistic falls in the critical region, that means the test statistic has a greater value than the critical value (for the right-tailed test) and the test statistic has a lesser value than the critical value (for the left tailed test).
A t-test is used to compare the mean of two given samples. Like a z-test, a t-test also assumes a normal distribution of the sample. A t-test is used when the population parameters (mean and standard deviation) are not known.
Since we know the population mean and standard deviation, selected the z test instead of t test
Thanks
Your explanations are better and easier to follow than those of my Statistics profs… Thanks
Thanks, Ben. That’s high praise!